Bitcoin Analysis + Some Entry/Exit TIPS
Hello there dear Crypto-Wacos, in this short post I will analyse a bit the current state of Bitcoin, just using the simplest way.

Photo by Worldspectrum from Pexels. source
Disclaimer: This may or may not represent a financial advice but be sure to make your own analysis first and take the responsibility of your own actions and trading operations. So the final move is up to you.
Less is more
Too often we talk about indicators and many patterns when doing trading. I can say that less is more based on:
- If you have many indicators you will become a real mess. Many times 2 different indicators can give you very different signals.
- By having many indicators you may loose time and action. If you need 2 min for each indicator, imagine how much time would you need to analyse a posible signal while using 10 indicators...
- The simplest the better. If you learn to read the price + volumen you can trace support lines, tendency lines and resistance lines. This is more than enough to study a Crypto graphic.
Do not get yourself involved into many things. The much things you need to test(indicators & patterns) the more you will become ineffective while studying a crypto currency on a graphic.
Some quick words about Trend lines

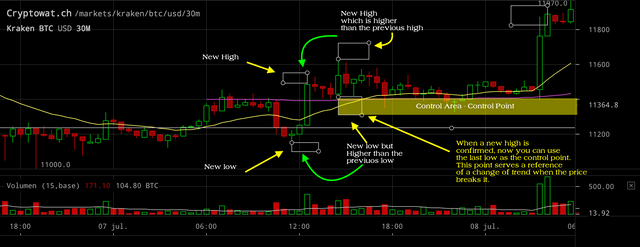
Courtesy of CryptoWatch
Too often people believe that a trend line must take just the lower points of a signal and that's it. Well, let me give you some advices when you are tracing a trend line. You must consider some aspects:
- In case of a high trend: take the most lower point from left to right.
- The next point it needs to be confirmed before you can extend the line from the previous point. You will get a confirmation when the next point it is being validated with a new high and also a new low(than is higher than the previous low) -See it graphically to the right-
- The last confirmed point(where you can trace the initial trend line) it is called "Control Point". You can trace a rectangle from this point to the right and this area it will be a place where you can confirm a change of a trend.
- In the case of the low trend if the opposite. I will explain this more deep in future articles.
Choose some temporalities an stick to them
It is necessary to study a graphic using any temporality that may give us good info about possible behaviours. In my case I always check:
1- Weekly chart.
2- Daily Chart.
3- 4 Hours chart.
4- 30 minutes chart.
Remember the market and any market is fractal. This means that any characteristic of a graphic will be reflected in a different time frame. As the time frame goes higher the behaviour will be slower and if the time frame is reduced(faster) then the graphic will be faster. We need to analyse a crypto from different time frames just to observe trends and sub-trends. We may see than a graphic of Days may show a high trend but we may detect sub-trends which can be low sub-trends when we observe the 30 minutes graphic. This is why we need to check all of them but stick to 3 or 4 of them all the time. We will develop firmed experience if we continuously repeat the same things over and over again. One day you may find yourself reading the markets pretty fast.
Where is Bitcoin right now and where it may go?
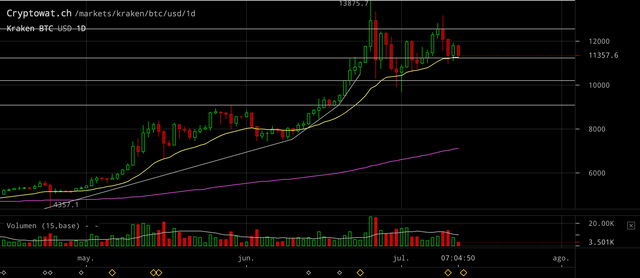
Remember something very important. When we talk about trading we talk about possibilities so everything is a probability. Nothing is certain but likely to happen. Today we see the current daily chart:

Daily Chart courtesy of CryptoWatch
I see the price making a strong support line which coincidentally is supported over the Moving Average of 20 periods. This may give us 2 possibilities: 1- It may break this point to the upside and try to reach the next resistance level around 12,391 - 12,550. But we need confirmation. This confirmation it may be: a strong green candle that must produced a higher volume than the last red candle. So far the last red candle it may be telling us something like "I can go down or the pullback has stopped".
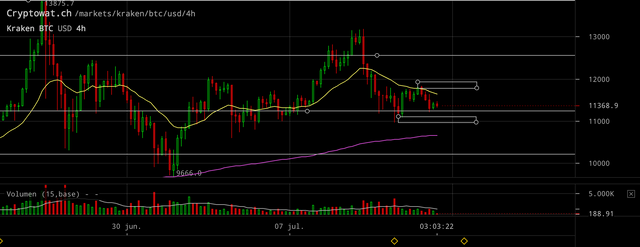
In the 4 hours chart we see this:

4 hours chart courtesy from CryptoWatch
I see some confirmation that maybe the selling is going off. I see this by observing the red volume within the red candles. It shows a red volume loosing strength. If you plan to go short you should wait until the price breaks the rectangle under. By breaking the rectangle area placed up, you may take a long position until the next resistance.
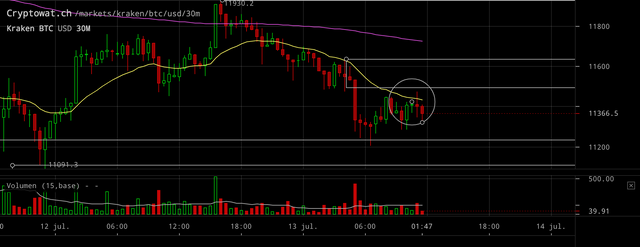
In the 30m chart we see:

Image courtesy of CryptoWatch
Basically when you use a 30 minutes chart as you chart to execute trades it means that you must wait 30 minutes to get a confirmation which is the time for each candle to form itself. In this chart I see a posible incapacity to break the SMA20(Simple Moving Average of 30 periods) but something that calls my attention is all those tales which represent "closing the price far away from minimums". Too many times this indicates than the selling force it is been absorbed and the price it may go up. In case case to go long, wait for the mm20 to get surpassed and you can get out in the next double roof of even on the mm200(200 periods moving average).
The entry may be defined by:
- A candle that comes with a higher volume than the previous one.
- A candle that show you a climatic volume. A climatic volume is a great volume much larger than the regular candles.
- A candle that shows you a big tale and it has the opposite color of the moving you are expecting. In example: if you expect the price to go up, the candle must be red and finish with a big tale to the down side.
Hope it helps!
You have a very good technical Insight. I personally think that Bitcoin will accumulate around $11000 - $12000 for a few weeks before it has a parabolic uptake . Have a look at my content if you wish to . Happy day!