How to trade bitcoin in 2018

The last year for bitcoin turned out to be stellar, as it started trading at $ 966 before the rally started, raising it already to $ 20,000. Even after the volatility that has covered the market lately, bitcoin has surpassed all other asset classes by a wide margin.
The main question that now worries everyone: what will happen in 2018, and how to trade bitcoin correctly?
Experts divided in opinions. Aggressively tuned bulls set a target for 2018 in the form of a threshold of $ 60,000. This is a 300% growth from the current level. On the other hand, skeptics continue to doubt the value of crypto currency, still calling them a bubble.
Some experts expect that in 2018 there will be sweeping swings in the bitcoin market. In the outrageous forecast of Saxo Bank there is a probable maximum of $ 60,000, followed by a fall to $ 1,000. Similarly, entrepreneur Julian Hosp (Julian Hosp) believes that bitcoin will drop to $ 5,000, but still he believes that the crypto currency will rise to $ 60,000. He is not sure which of the predicted marks will be reached first.
Despite the fact that the forecasts offer us different opinions, it is difficult to trade on the basis of them. Therefore, we decided to identify several unique patterns on the charts, which were repeated in 2017. Traders can use them as an override to develop an appropriate strategy in 2018.
50-day SMA
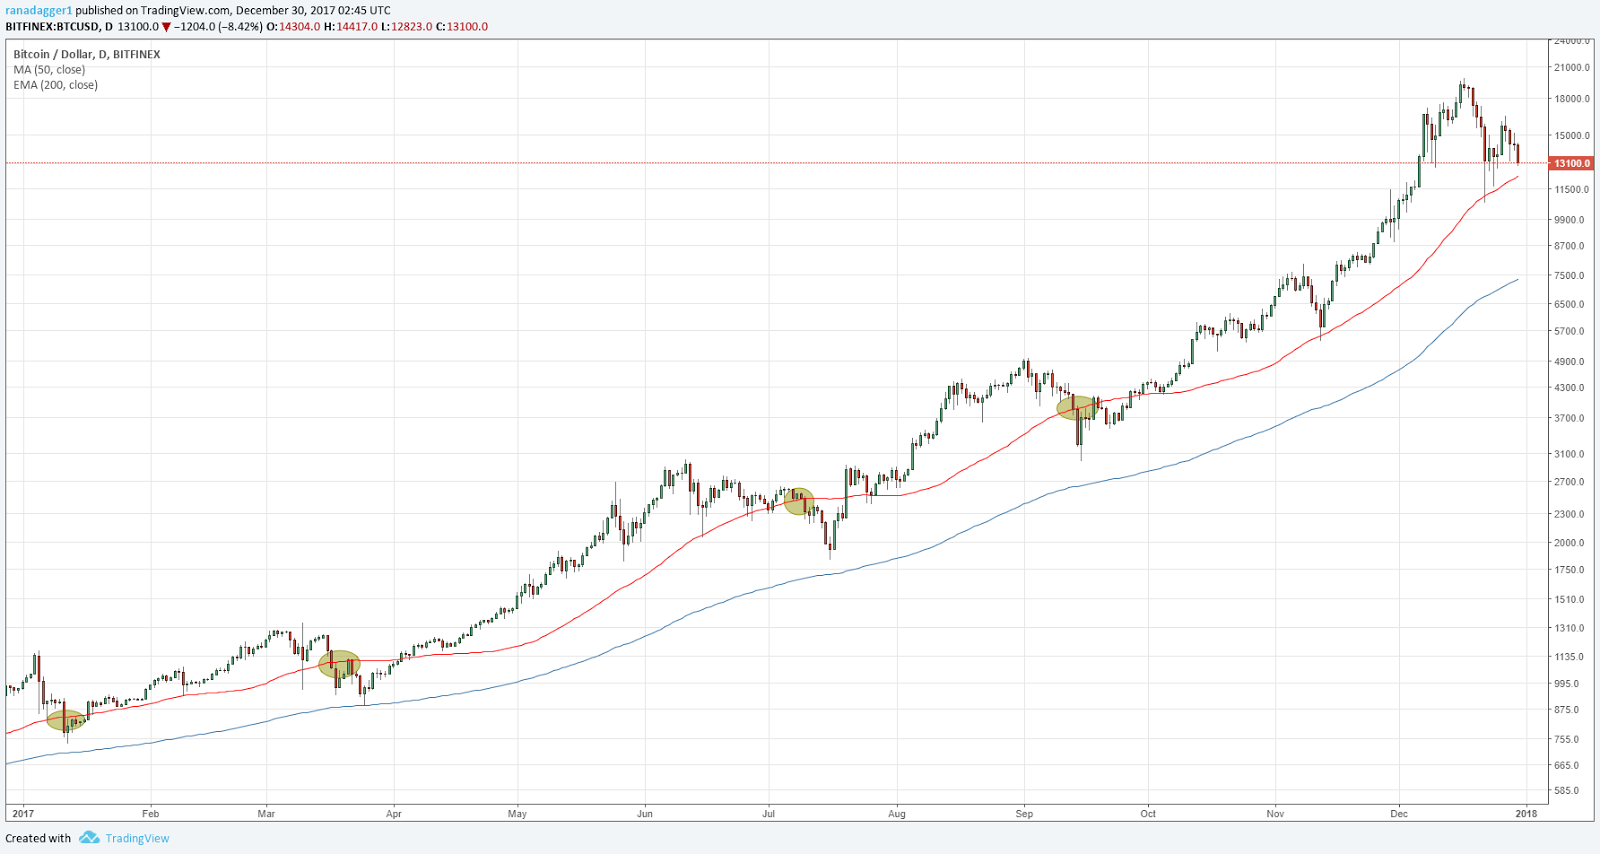
In 2017, the 50-day simple moving average (SMA) played the role of key support. As we can see on the graph, this level was broken four times.
In all other examples, bitcoin quotations were related to the moving average level or lowered during the afternoon session, and then quickly recovered. Consequently, buying near the level of a 50-day SMA will be an opportunity with a reduced risk. Buy closer to the 50-day SMA and keep a stop-loss order below it.
200-day EMA
As we progressed to a 20-fold growth point, bitcoin offered many opportunities to enter a market with low risks for long-term traders in 2017. Bitcoin did not trade below the 200-day exponential moving average (EMA) level since October 2015. This level is key to supporting .
In 2017, even when bitcoin erupted below the level of the 50-day SMA, it passed at a considerable distance from the 200-day EMA. This turned out to be an excellent opportunity for long-term investors. Even with the next drop, the approach close to the 200-day EMA should be seen as an opportunity to buy.
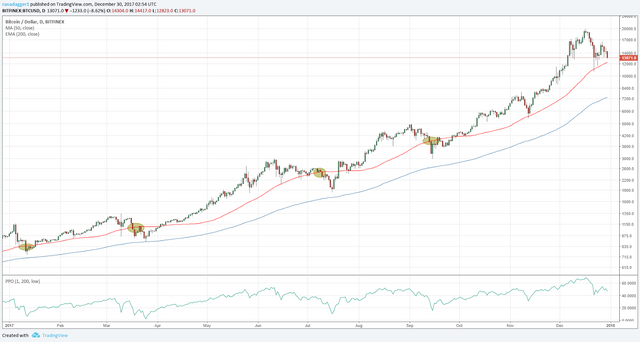
The price does not necessarily fall to the level of the 200-day EMA, even during a major correction. On January 12, for example, it fell to 6.5% above the level of the 200-day EMA. Similarly, March 25, it was 2.5% above the 200-day EMA. On July 16, the fall was 10.7% above the 200 EMA.
Although this is not an ideal plan, traders can start buying at about 15% above this indicator, while keeping a step-by-step buy order below this level.
How can you calculate how far the price is from 200 EMA?
Although there is no specific indicator, we can use the "price oscillator" (PPO), wisely changing its values. The PPO indicator shows the percentage difference between two exponential moving averages. Therefore, if we need to calculate how far these values are from the 200-day EMA, we can maintain the values at 1200, and this will give us the desired result.
What if bitcoin commits a breakdown below the 200-day EMA?
If the quotes break below the long-term moving average, this will be a warning signal that the state of affairs has changed. This will indicate that bitcoin either enters a long downward trend, or starts a jump with large fluctuations, which will require a different trading strategy.
In trading, profit is made through purchases and sales at the optimum time. We have already identified a bullish strategy with low risks, but we still have to choose the best time to sell. Let us now take a look at this.
Best selling price
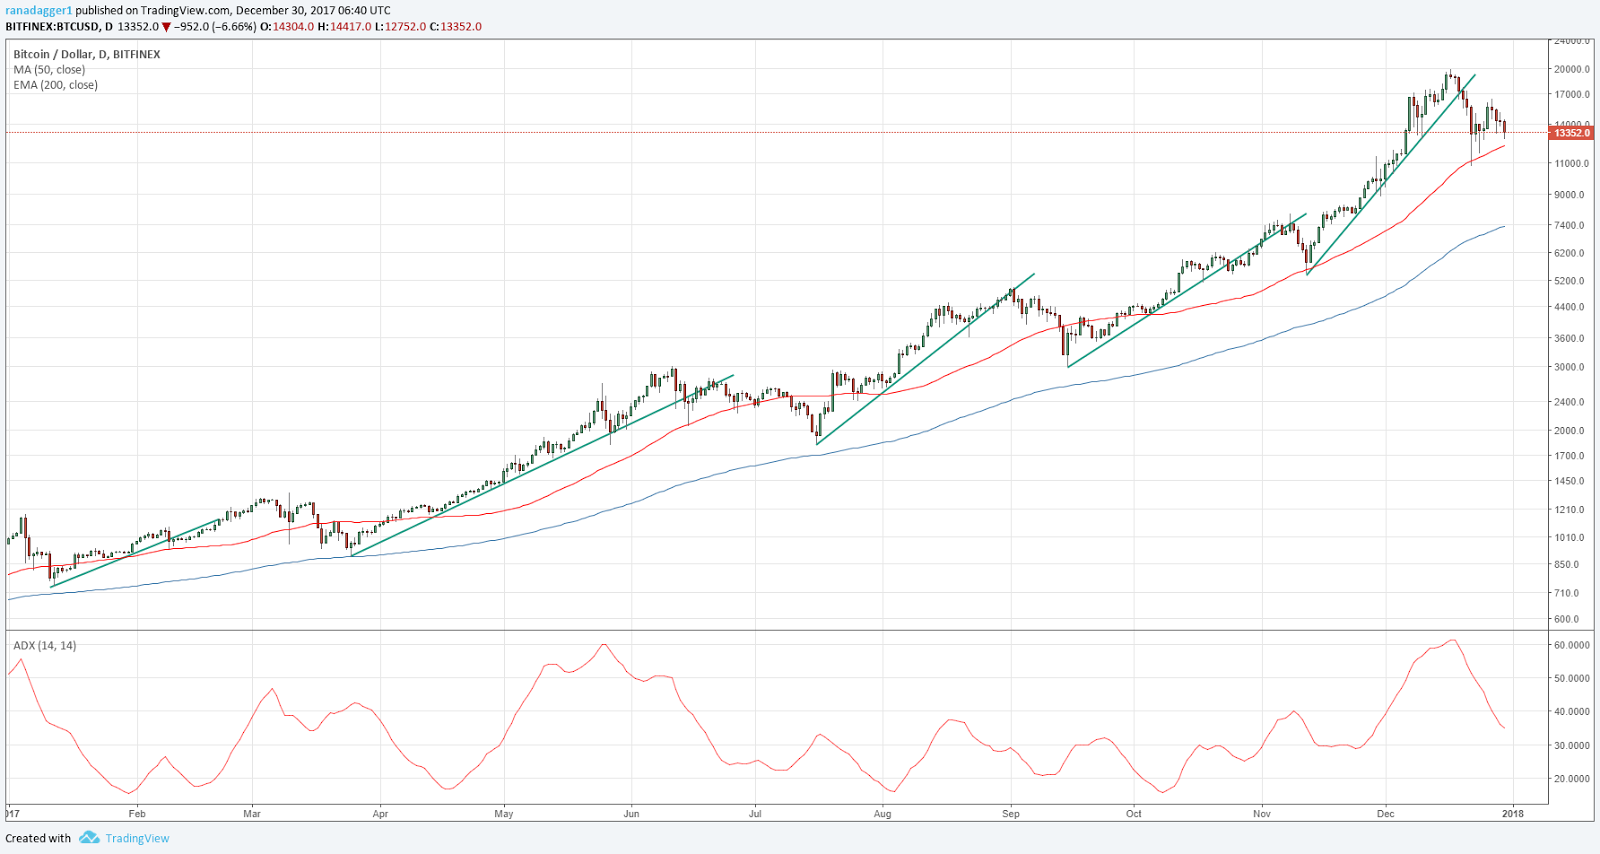
There is no indicator that would always give the signal for the most profitable sales. But it was noticed that a simple trend line handles this.
As noticeably higher, although the breakdown and closing below the trend line did not take you out of position at the highest price point, this, of course, helped to fix most of the profit.Another useful indicator - ADX (index of the average direction of traffic).
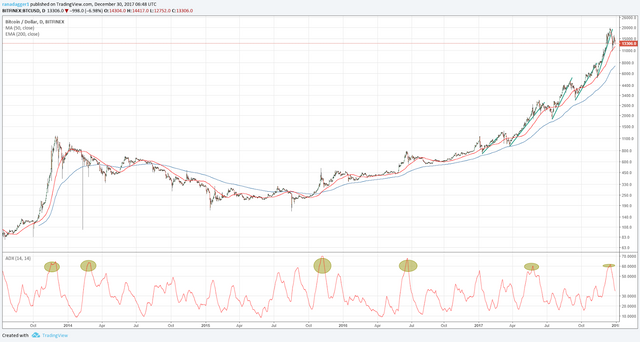
As early as 2014, ADX above the 60 mark was an excellent point for the sale of bitcoin.How to approach bitcoin trading in 2018?It is easy to determine and see where and how the indicators worked when the chart has already been formed. Doing the same "live" during a trade is not an easy task. In general, it is almost impossible to predict the price movements of the currency for a whole year ahead, because the market is still young and does not have formed repeated patterns of price behavior. Try to avoid long-term forecasts. Happy shopping.