Bitcoin's Price May Be Charting a Bull Reversal 🐯
Bitcoin's Price May Be Charting a Bull Reversal 🐯

Notably, BTC could end up creating an inverse head-and-shoulders pattern (bullish pattern) soon if the bears fail to penetrate the immediate support of $6,000 in the next couple of days.At press time, BTC is changing hands at $6,350 on Bitfinex – down 3.6 percent on a 24-hour basis.
Daily chart
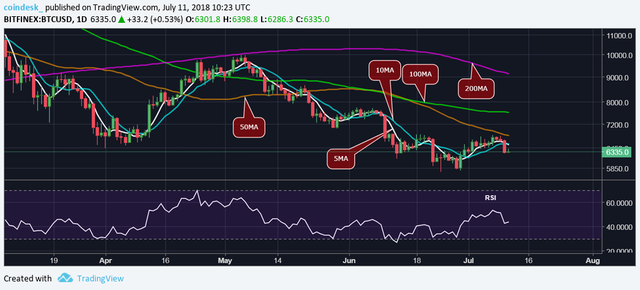
The 5-day and 10-day MAs are also beginning to slope downwards in favor of the bears.
The long-term MAs – 50, 100 and 200 – are located one below the other, indicating the path of least resistance is to the downside.
Thus, BTC looks set to test $6,000 in the next day or two.
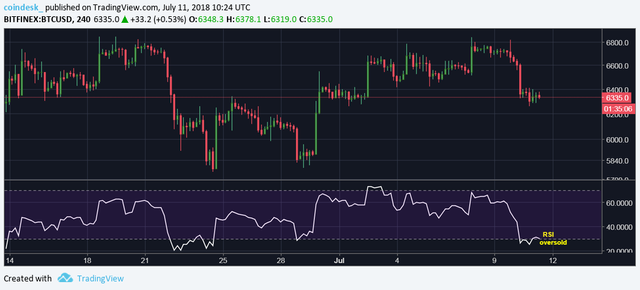
Acceptance below that level would expose the recent low of $5,755.However, the short duration charts indicate BTC will likely defend the support at $6,000.
4-hour chart
View
- BTC's close below 10-day MA yesterday has neutralized the immediate bullish outlook.
- The immediate support at $6,000 could be put to test in the next day or two, but the probability of a break below that level is low.
- A high volume rebound from $6,000 would help BTC chart an inverse head-and-shoulders bullish reversal pattern.
- A daily close (as per UTC) below $6,000 would boost the odds of a drop below $5,755 (June 24 low).