BTC and Another Bullish Price Pattern Break
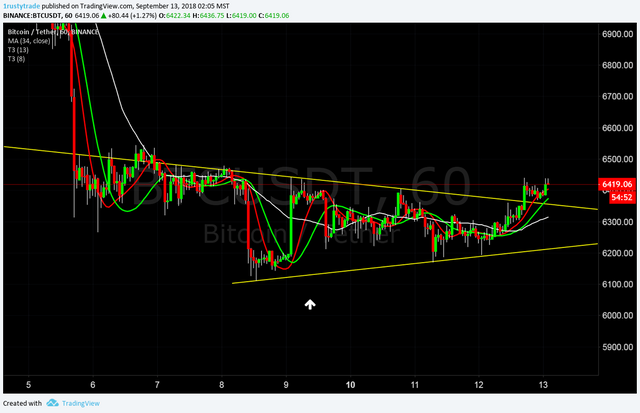
60m Intraday chart showing a price pattern known as the reverse head and shoulders bullish pattern signifying a bottom. Although price patterns can fail this Reverse H&S is not the first time we have seen them.
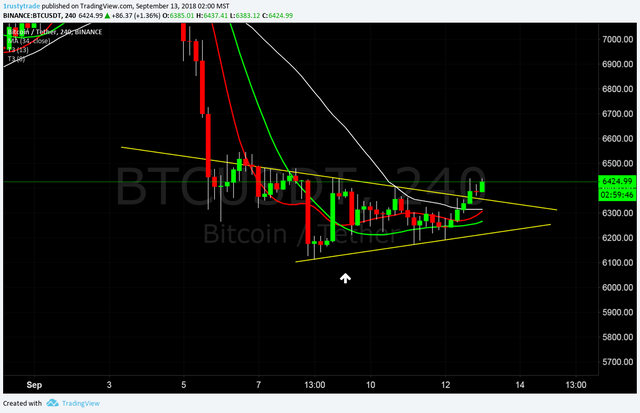
The 4 hr chart of BTC you can see the nice break across the neckline.
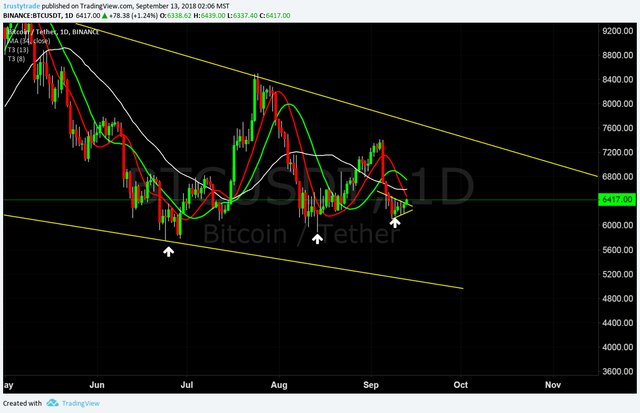
On the longer term chart, the daily BTC shows the higher lows are still intact. We must make sure the higher lows keep building. Higher lows show support is building. Especially important on longer term charts.
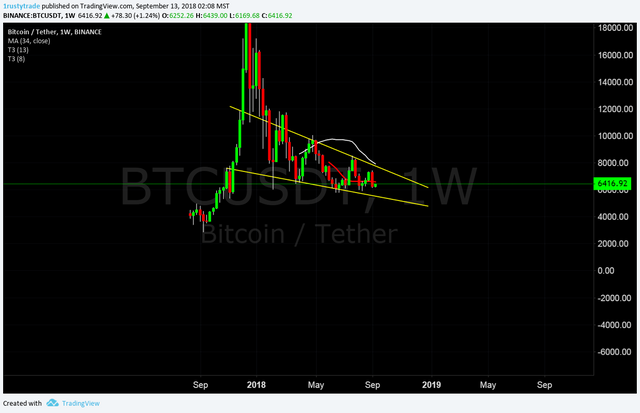
Now we wait for the weekly to BUILD-BUILD-BUILD. Then pop across the long term resistance lines.
Happy Trading