Bitcoin Time & Price Cycles for Jan – Mar 2018
For this study I used the three cycles which had the highest Pearson Ratios of the top 100 cycles.
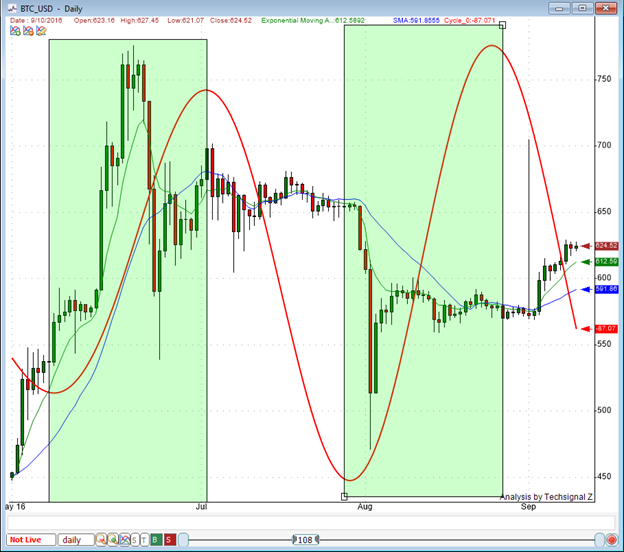
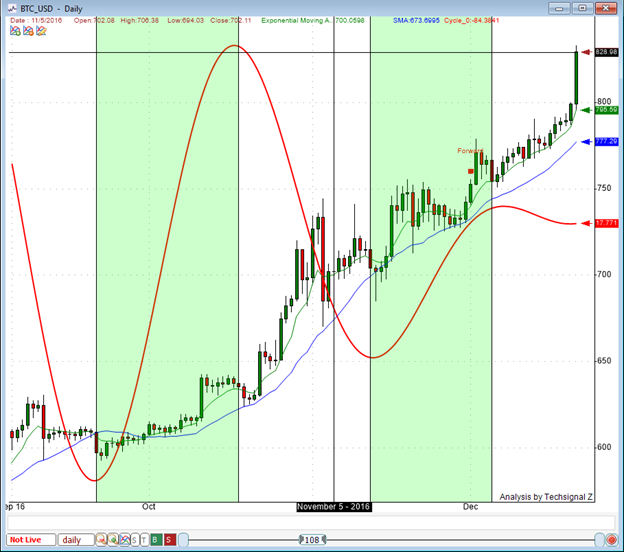
When all three cycles sync-up, a high or low should be expected. The cycles used were the 58.70, 47.64 and 55.10. Cycles of this length do not sync-up very often.
The actual highs and lows are highlighted in yellow. You can eye-ball the correlation between the cycle clusters and the actual highs and lows.


Updates are posted in the OSS NIGHTLY INDICATORS newsletter.
http://oss.cc/oss_Subscription.asp
Another way to view the cycles is to combine them into one cycle.
It can be quite profitable to trade the cycle by going long at the bottoms and selling at the top, but remember it does not always work. Other indicators should be employed in combination with the cycles. I’ll talk about the indicators I find the best in another report.


Let here by ol' jsnip4.... very interesting find! I'm learning more and more about TA, but have always been fascinated by the correlations that people have learned to glean.
There is a free newsletter available on the home page at http://oss.cc
I'll second that @doctorrevelator - that's how I found it as well, interesting indeed! Although I'm not totally clear on what the cycles "58.70, 47.64 and 55.10" actually are... ?
Tampa joe is an acquaintance of mine...watched his video referencing you. I just followed you. Thank you.
Another snippet this way comes . . . and with a question. I note the Techsignal Z logo on your charts, but that site is rich with choices. Can you guide me to a basic cycles platform? Thanks.