Crypto Analysis Report 7-20-18 BITCOIN...The Bottom Is In
I last spoke about Bitcoin almost three weeks ago,
I talked about Bitcoin showing some signs of life, despite price still being in a downtrend on the daily chart. In addition, there are still sellers at the $6800 level, so until price took out the $6800 level, there is still downside risk.
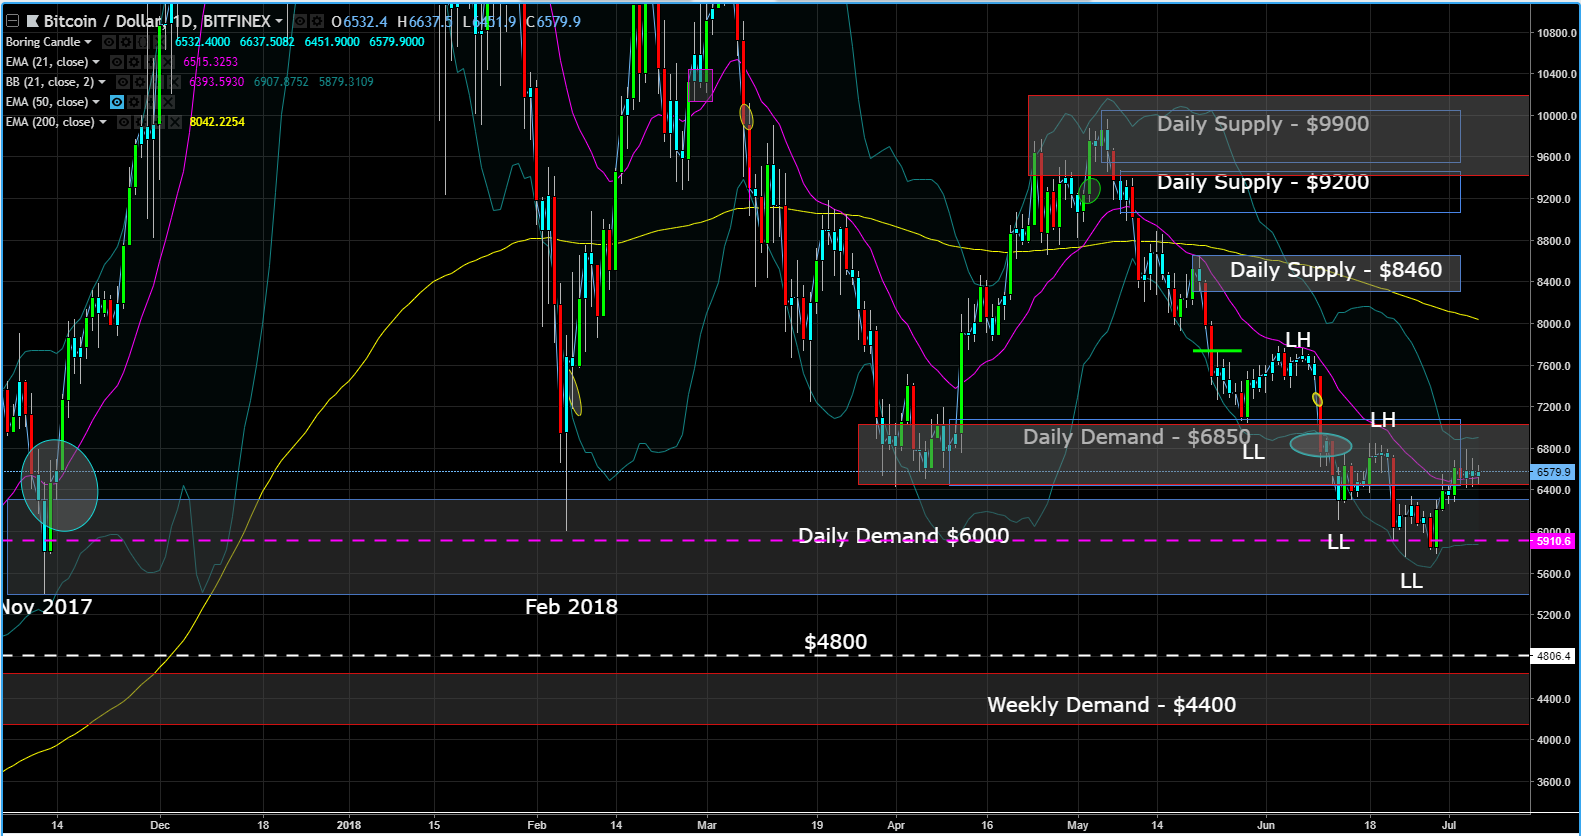
This past week, Bitcoin has sprung back to life and passed its first test by breaching the $6800 level that plagued it back on 6/20 and 7/8.

While breaching the $6800, price formed a new uptrend. Price is stalling near the $7600 level currently. I don' think the level at $7600 is considered resistance or a supply zone because there was too much training at that level as indicated by the yellow rectangle. The chart is suggesting price will continue to move higher and battle the sellers at the daily supply zone at $8460. Based on the current momentum, the chart is also suggesting that price can move as high as $10000 in the short to medium term.

This post is my personal opinion. I’m not a financial advisor, this isn't financial advise. Do your own research before making investment decisions.

Published on

by rollandthomas

nice charts - I think if we can break higher this weekend, $9400 USD target is plausible in the short term. Let's go bitcoin...
Thanks @sagesigma...yes, LETS GO HIGHER BITCOIN.
Welcome back @rollandthomas. If Bitcoin can break the descending resistance, I agree, $8,400-$8,500 is very possible in the short term. Volume remains steady. Clearly new buyers are slowly entering the market. Let’s see if we can finally breakout, or if there’s one more wave down. I’m a bull at heart...so GO BTC!
Thanks @workin2005, good to be back....GO BTC!!!