Trading Cryptocurrency with Advanced Fibonacci / 23.09.2018 (Bitcoin)
BTC/USD
We couldnt see a follow through on the buy signal at weekly timeframe yet. Stop grabber buy pattern which targets previous high at 8450 is still valid. Interestingly we have cluster of fibonacci expansions just above the highs at 8550. This will be the first key resistance d-level on the weekly charts for bitcoin and we have another big fibonacci agreement resistance zone higher up around 10k-10250.

Looking at our weekly fibonacci support levels; we dont have anything new.. Levels stands as the same. We have 0.618 support at 5700-5800 and massive support cluster of fib levels around 4700-4800k.

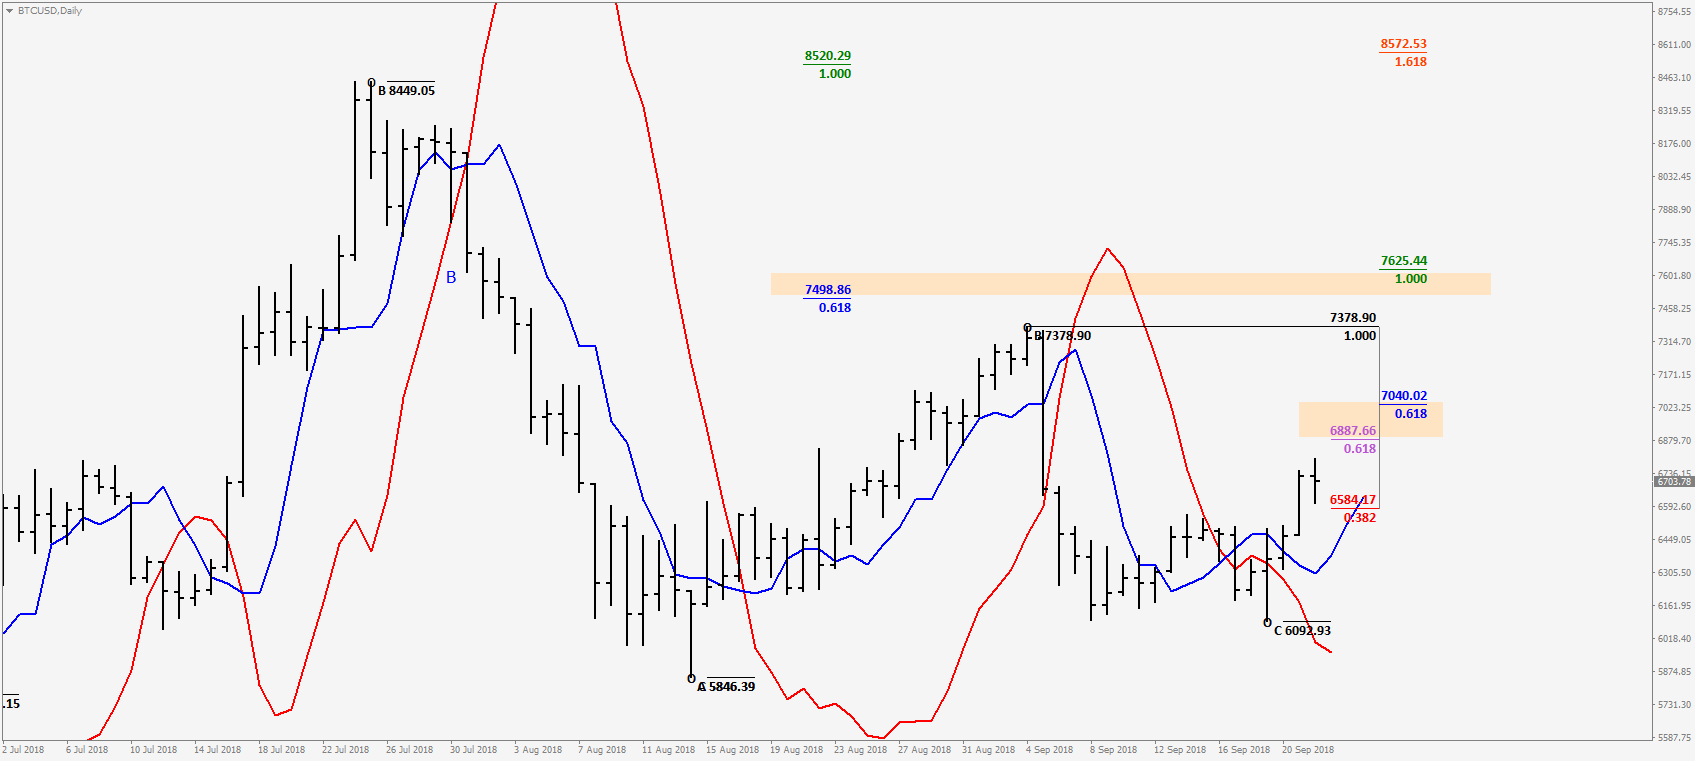
When we look at the daily chart; We had a wash and rinse of previous lows 3 days ago and market rallied immediately after that. We have a litte bit resistance around 6900-7000 zone. A pullback is a buying opportunity towards that resistance zone and higher up we have more levels at 7550-7650.
When we zoom down to 4 hr chart; we see a nice conflunce support around 6500. Weekly trend is up, daily is in a buy so fading 4hr sell around 6500 support zone looks reasonable.

Remember the levels may vary depending on exchanges so please re-draw fib levels on your own trading exchanges.
Hi, awesome post!! :)
Are you interested in earning STEEM and SBD passively?
If so, try might wanna check this out.