Some LOG-charts of Bitcoin
Just doing some doodling in tradingview.com. I'm not deeply into technical analysis, but I do not consider it a rigorous science either.
NOTE: To see full picture, right-click image and open in new tab.
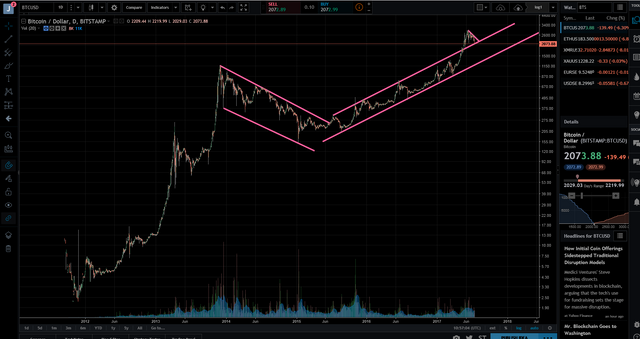
I use a logarithmic chart for long term bahoviour of an asset. For very short term behaviour it doesn't matter much whether you use linear or logarithmic y-scale.
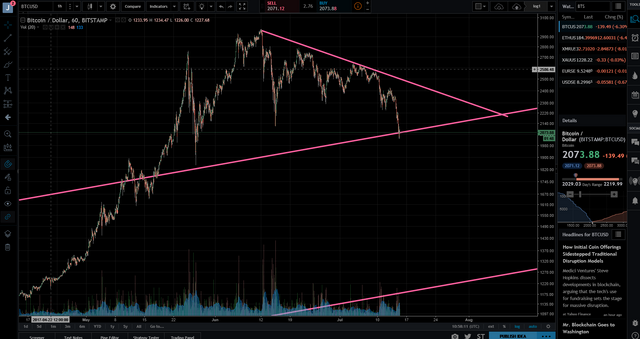
Below is a zoom-in for the last 3 months:
If we assume the bitcoin price will remain inside the upward trend-channel, then we could go as low as about 1200 USD long term (lower pink line)