A long term price chart for bitcoin 170826
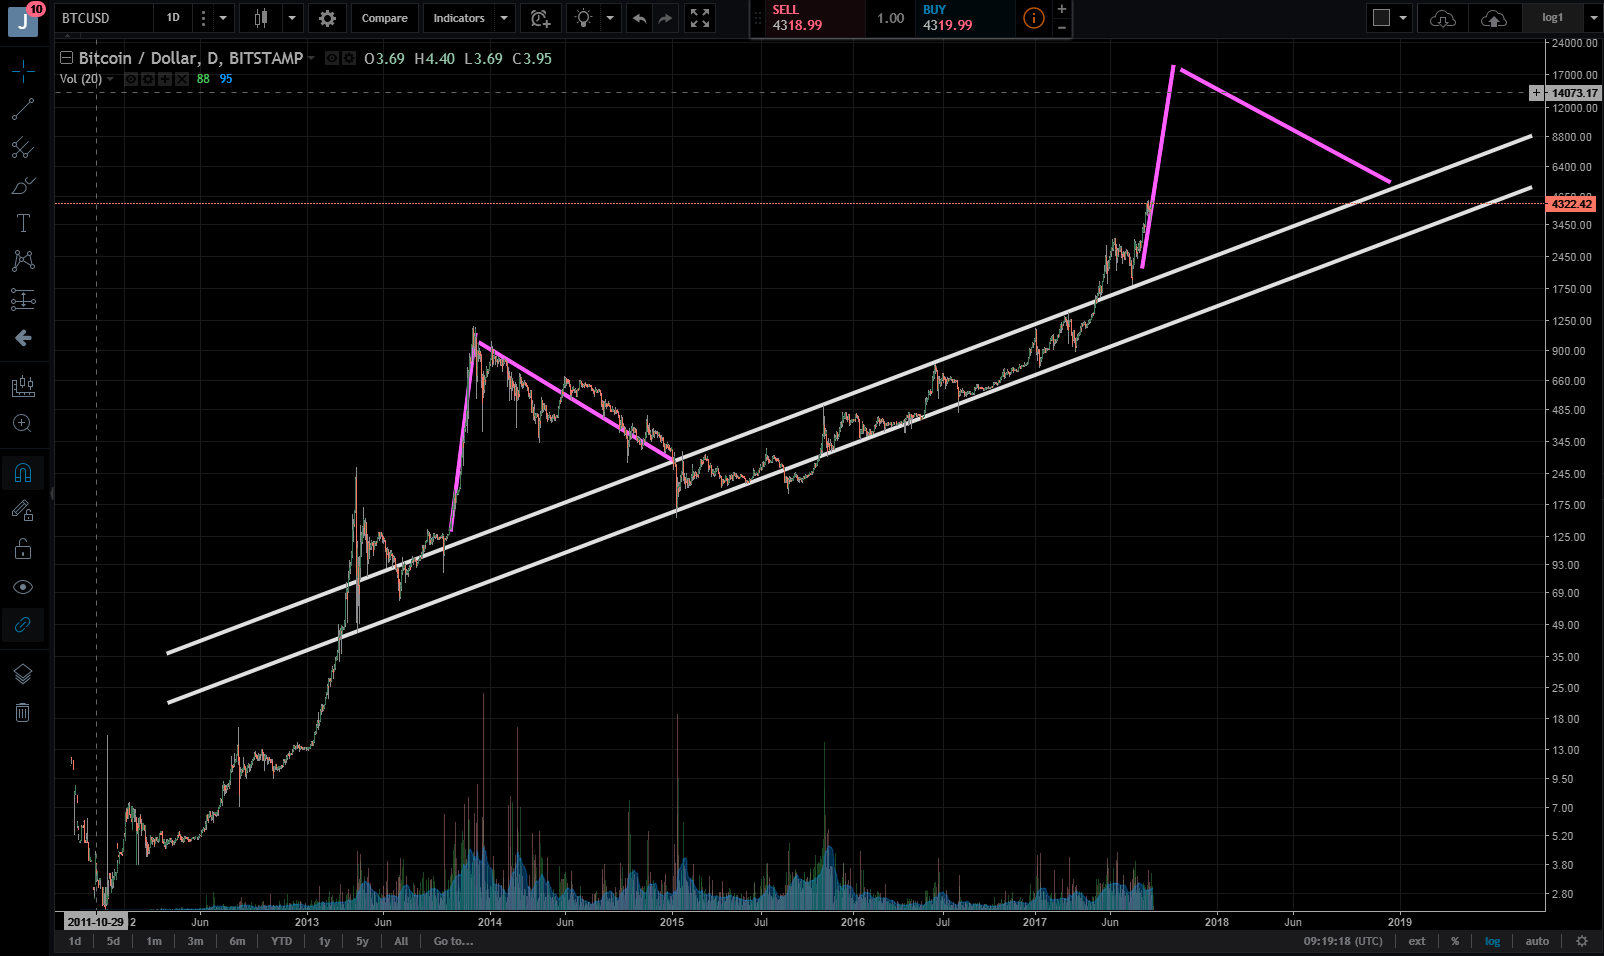
This is a price chart for bitcoin 2012-now. It is a log chart and I have added a trendline following the rise jan 2015-may 2017. If we look at the price sep 2013 - jan 2015 it looks like a big hump above the white trendline.

Maybe it's time for a next big hump (in pink below) that has started around may 2017? In that case HODL until bitcoin reaches $18000 maybe around october! To the moon!!!

I will support you, God bless you, I learn english, so if I made some mistakes, then I apologize and keep it
thank you very much
非常感谢你