Bitcoin Volatility Returns
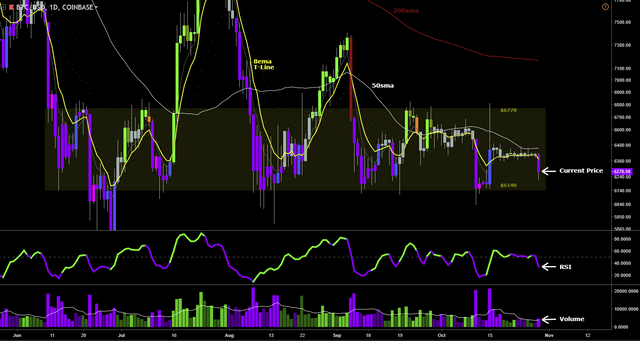
Finally getting some volatility in Bitcoin after two-weeks of sideways action, but probably not in the direction most of you wanted to see. Price broke down after failing to move above the 50sma which is the level we needed to see Bitcoin move above in order to attempt a break of the 2018 downward trend. Price is also below the yellow trigger line which means no buying any time soon for me. Ideally what I want to see in order to become bullish is for price to trend above the trigger line with at least two candle closes above the 50sma and with the RSI above its centerline, which for now the RSI is trending down from meaning we have a short-term downtrend. Volume is picking up a little here to the downside so I wouldn't be surprised to see more weakness over the next few days. Yellow rectangle shows key price levels that need to be broken for bulls and bears alike. $6140 needs to hold as support or bears will gain control and take price lower, $6770 needs to be broken in order to get bulls buying again.
