BITCOIN Teknik Analizi / BITCOIN Technical Analysis [15.04.2018]
Selam arkadaşlar;
Burada yer alan bilgi, yorum ve değerlendirmeler Yatırım Danışmanlığı Kapsamında DEĞİLDİR. Yapmış olduğum analiz ve değerlendirmeler teknik verilere dayalı eğitim çalışmasıdır.
Logaritmik ölçekli günlük grafiktir / Daily chart with logarithmic scale
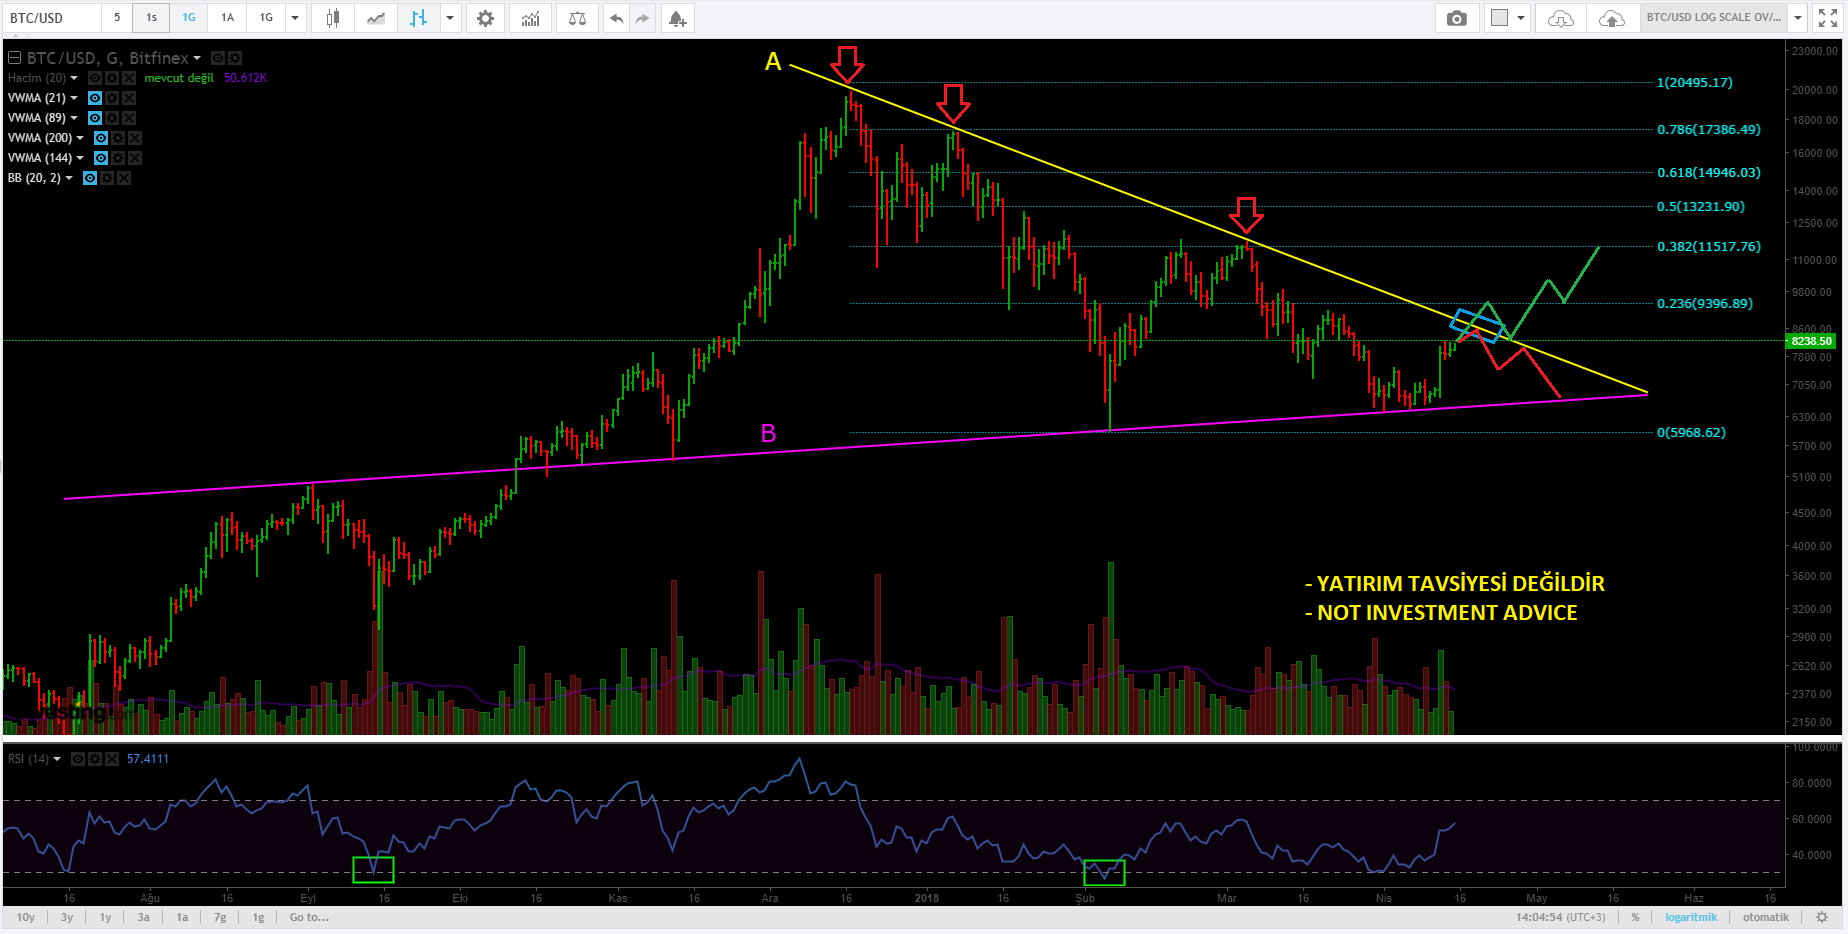
- BTC B trendi üzerinde bir müddet oyalandıktan sonra gelen tepki ile nihayet yükseliş hareketine başladı.
- Hali hazırdaki duruma göre A trendi trendi önemli direnç olarak takibimizde olmalıdır. (Önceki hareketleri inceleyecek olursak A trendinin direnç olarak nasıl çalıştığını görmekteyiz.)
- A trendinin geçilmesi durumunda (hacim ile desteklenerek) "FIBO 0.236(9396$)" seviyesi direnç olarak gündeme gelecektir. Bu seviyede belli bir süre düzeltme hareketinin gerçekleşmesinin muhtemel olduğunu değerlendirmekteyim.
- A trendi geçilemez ise yön maalesef yeniden aşağı dönecektir. Bu durumda 7200$ seviyelerinde destek bölgemiz bulunmaktadır. Eğer Satış baskısı sertleşir ise B trendi önemli destek konumunda olacaktır.
- RSI indikatörünün yönü yukarı olması yükselişi destekler niteliktedir.
- Grafikte belirtmiş olduğum yeşil ve kırmızı çizgiler fiyat hareketinin izleyeceği muhtemel yolları göstermektedir (Tamamen şahsi görüşümdür. Gerçekleşmesi kesin değildir.).
Teknik analiz ile ilgili sorularınızı ve eleştirilerinizi yorum olarak yazmanız beni mutlu edecektir.

English
Hello Friends;
The informations, comments and evaluations contained herein are NOT IN Investment Advisory. The analyzes and evaluations I have made are based on technical data.
- After a while on the BTC B trend, the reaction finally started to rise.
- According to the current situation, A trend trend should be followed as important resistance. (We will see how A trend work as resistance when we examine previous movements.)
- If the A trend is broken up (supported by the volume), the "FIBO 0.236 ($ 9396)" level will come into view as a resistance. I am evaluating the possibility of a corrective action at this level for a certain period of time.
- If the trend A can not be passed, the direction will unfortunately go down again. In this case, we have a support zone of $ 7200 levels. If the sales pressures get harder, the trend B will be in a significant support position.
- The upward direction of the RSI indicator supports bullishness.
- The green and red lines that I have indicated on the graph indicate the possible ways in which the price movement will follow (It is completely personal, it is not certain that it will happen).
I would be happy if you write down your comments about technical analysis.
Önceki BITCOIN Teknik Analizlerim / My Previous BITCOIN Technical Analysis
1-Bitcoin Teknik Analizi / Bitcoin Technical Analysis [31.01.2018]
2-Bitcoin Teknik Analizi / Bitcoin Technical Analysis [25.02.2018]
3-Bitcoin Teknik Analizi / Bitcoin Technical Analysis [05.03.2018]