Bitcoin TA (Part 2): May 21st, 2018
TA from a friend of mine:
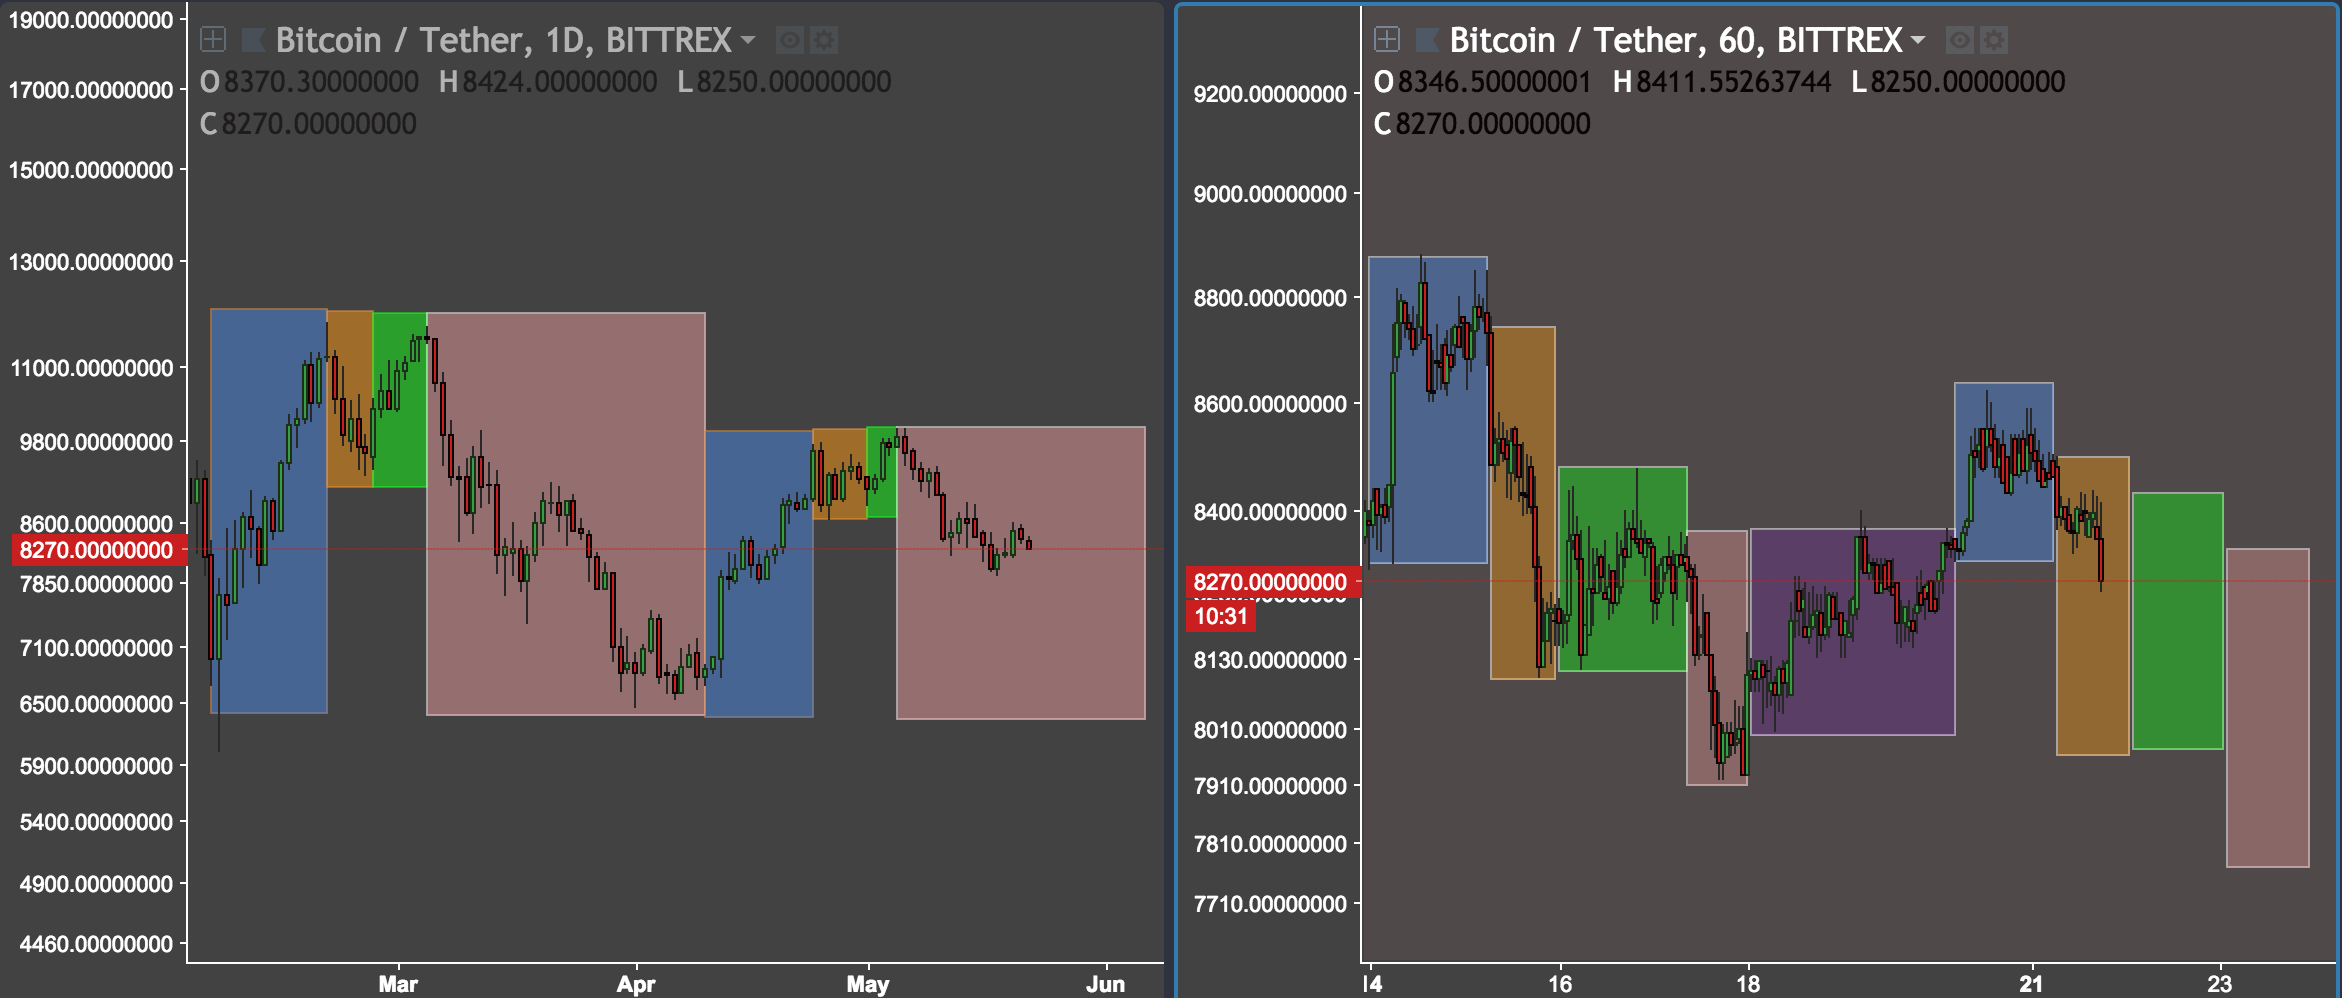
BTC Update: On the left 1D chart shows a fractal pattern that I had mentioned last week. We're currently still in the red part of the fractal and have more downside (potentially) if the previous late March - April's history will rhyme again.
On the 1h chart (right) I've noticed another similar fractal pattern playing out. Since May 14- May 18 we started at $8,878 and headed down to $7,917. Now we're playing the same fractal on the right, currently in the gold. I'd expect the gold fractal to play to high $8,000- low $8,100. Then we'll begin the consolidation in the green ($8,000-8,200). And then further decline in the red ($7,600-7,800). Furthermore, if we are to hit our June 6th reversal target, then I expect the purple fractal to play out with a slight movement up and replay this fractal again blue > gold > green > red and fall even more into low $7,000 range or high $6,000s. Again, this is just a theory of mine.
Currently we're waiting on the gold fractal on the right on the 1h chart to play out. Let's see how it works
Also, I just unveiled my new ICO ranking spreadsheet here.
Interesting theory. Thanks for sharing.