Bitcoin TA: May 21st, 2018
TA from a trusted friend:
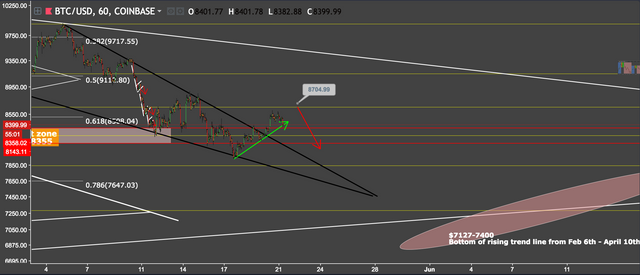
I wrote a weekly report yesterday in which I showed the movement above of us reaching to $8,704.99 and then heading down. I was off by $60 or so. But I had an inclination that this would be the initial setup of a bull trap laid out from the fake bottoming at the $7,900 range. And as you can see now we've gone from $8,600 to now mid-$8,300s. I expect further decline over the next few days However there will be an down-up-down-up style movement as stocks/crypto never move straight up or down. That green arrow is our uptrend that we've been bouncing off. I expect to bounce a little off it and then come back down. The ultimate target range I've listed is the red ellipse listed at the bottom of the rising trend line by our June 6th marker. I do not feel the need to pull up the indicators. The basic price action and volume is telling me the whole story. When markets get manipulated the indicators become ammunition for bots and traders to use. So I feel no need to make judgements off those. We are going back to the basics of watch pure price action and stay one step ahead of the bots, traders, and whales.
This is really and objective and constructive forecast.
Thanks for sharing this wonderful clue sir.
Again you have my upvote sir.