Bitcoin TA for May 18th, 2018
Not my TA, but a trusted analyst.
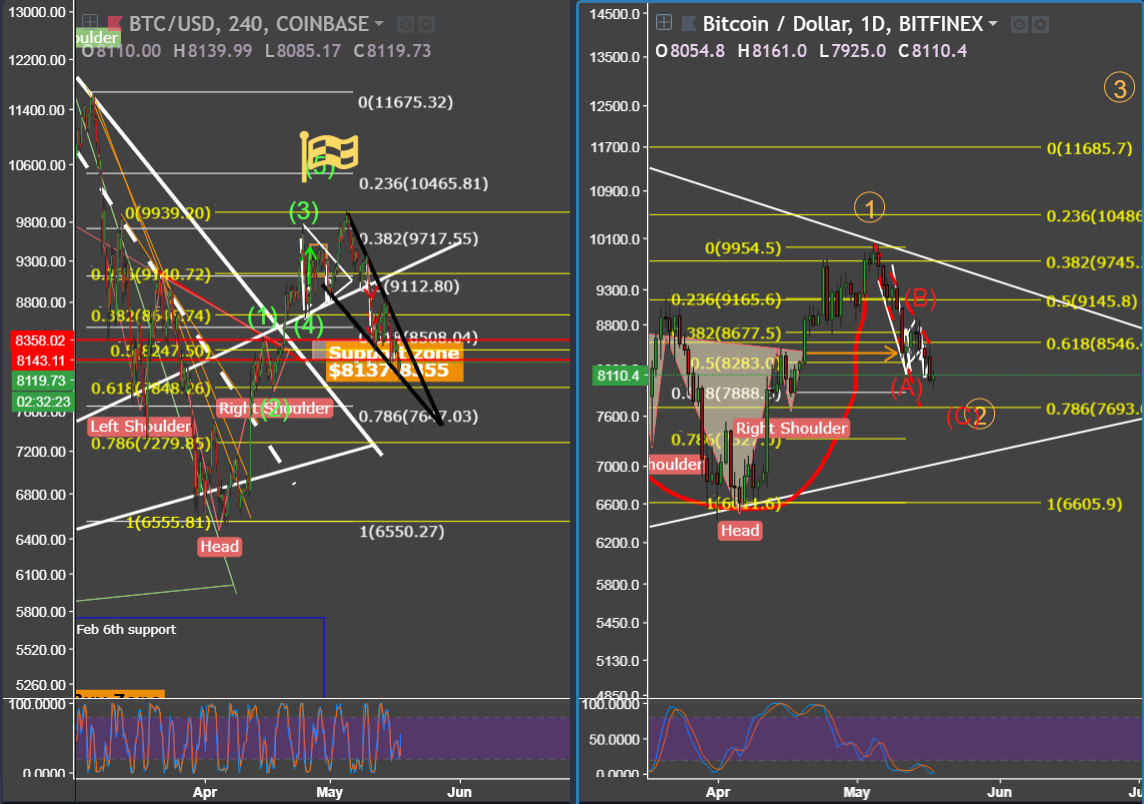
On the left is the 4H Bitcoin chart and on the right is the daily. The 4H shows a clear falling wedge for BTC (black). And as per historical patterns, BTC falls 75-90% inside patterns and breaks up/down depending on the patterns typical outcome. So it looks like we're coming close to that % listed and that may correlate with our 618 around the $7,800 level. Last night we broke the $8,000 level but clearly got bulls pushing us back up over $8,100 again. This means there is buy pressure to keep us at $8,100 but not enough to overcome the sell pressure. And so I will expect even a further decline with that 618 fib level as the next level of support. Now on the 1D chart, I also stated yesterday that if we're in the ABC corrective wave after the EW 5 wave completion. We should again coincide with that 618 fib of $7,800 range. The ABC will also correlate to the larger corrective wave 2 as shown. But we have to be sure that this is an ABC corrective wave not an ABCDE which could signify a deeper correction possibly taking us to the bottom of that white rising trend line near $7,000-7,100. But we do not need to speculate on this. We only look at what's in front of us right now. And for now, it is okay to take into consideration that we may be in the ABC corrective pattern. The stoch RSI on the 4h is picking up but the 1d is over sold. However, the 1D stoch RSI can be there for a solid 4-6 days so it may not bounce right away. Let's hope we find lots of buyers at the $7.8k fib level.
Good TA
Great analysis