[Bitcoin -- August 12, 2018] A detailed picture of the full and (potentially) final count of this bear market
Please note: to view images in their full resolution, right click the image and open it in a new tab.
I will try to make a case for the full (bull) count of this bear market/correction, starting from scratch. This post is an attempt to provide you with the theory behind the count, using Elliott Waves and Fibonacci retracements and extensions. Utilization of a vanilla pitchfork and the RSI oscillator will give insight towards a probable moment in time as to when we can expect this almost 8-month bear market to come to an end.
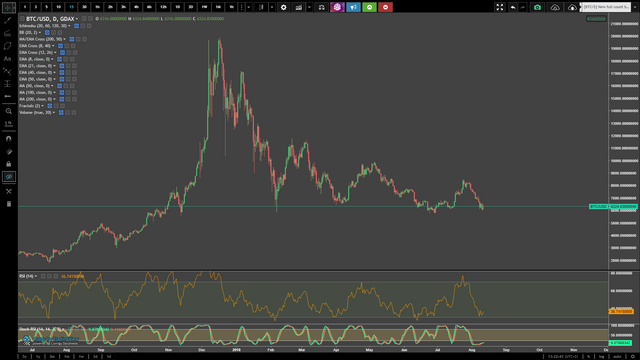
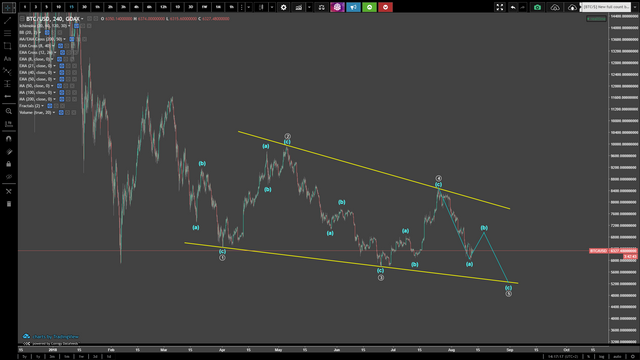
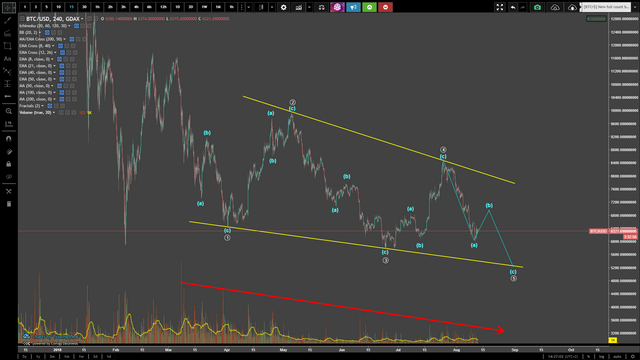
The current (blank) look
Building a case until the February low
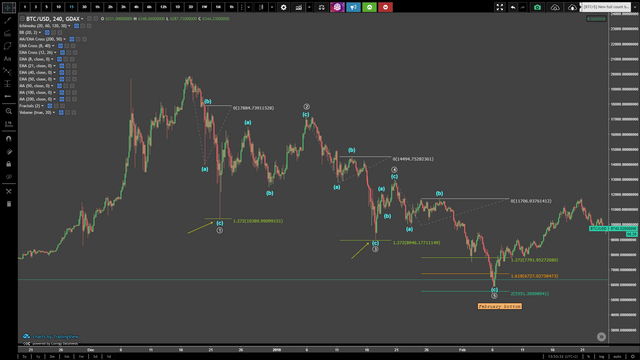
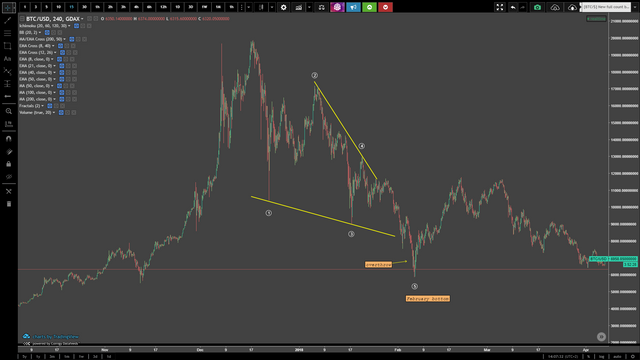
Let us build the full count by first looking at the wave structure that lead to the first bottom in February 2018. Hindsight is 20/20 vision, thus we should be able to clearly see what was going on.
I propose that the way these waves can be counted is potentially twofold.
One can argue from the stance point of an ABC, as shown below:
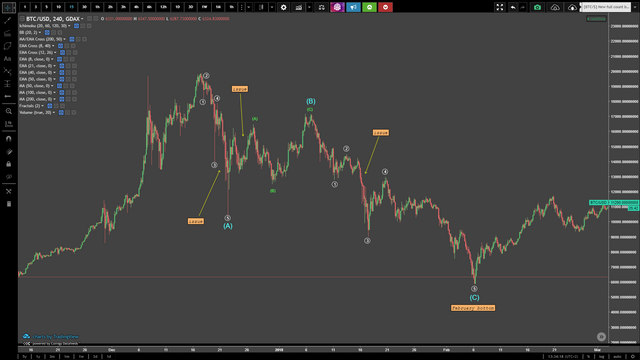
Now let us look why I consider this count flawed. An ABC correction of this structure requires subwaves 5-3-5. In an attempt to fit these subwaves to the structure of this correction, you can clearly see that a few issues pop up. First of all, the subwaves of the cyan (A)-wave are very extended and show little to no subdivision.
Secondly, (and I recall running into this issue back when these waves were taking shape back in December) the green (A) wave is supposed to have 5 subwaves as well. However, this green (A)-wave is clearly 3-wavish, which leads to believe that this is not impulsive at all, but rather corrective. As such, I consider this invalidation of Elliott Wave rules.
Third and last: The cyan (C)-leg, which is supposed to have 5 waves as well, has an obvious issue when it comes to the length of the 3rd wave. While it is not the shortest and as such abides to the rules of a 3rd wave, the white 1 and the white 4 waves overlap, which is not allowed in an impulsive count (be it to the downside or the upside). The retracement of the white 2 wave is very shallow and atypical of a second (large timeframe) wave.
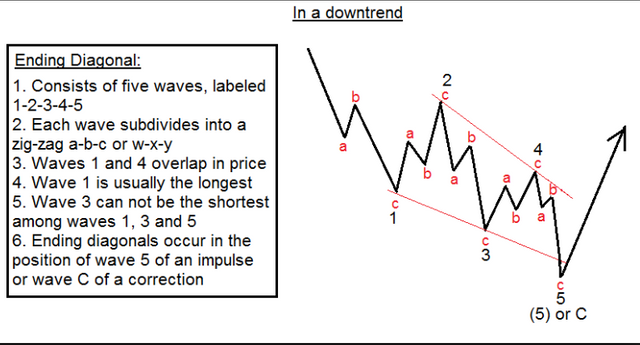
What could be a better fitting count for these waves? A leading diagonal, with subwaves 1 through 5, where overlap is allowed.
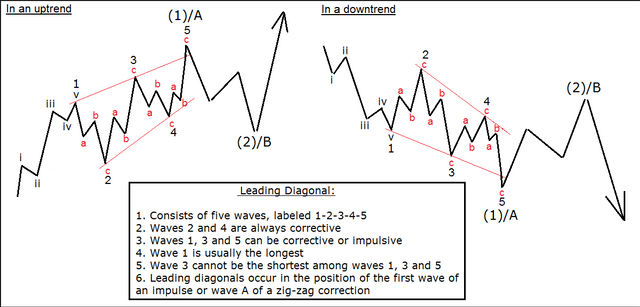
Note the rules and theory in the above image. The leading diagonal on the right (downtrending) is the one we are after. One comment: this image shows the first wave having 5 subwaves (i, ii, iii, iv, v), however as rule 3 states, wave 1, 3 and 5 can be corrective or impulsive; meaning they can either have 3 subwaves or 5 subwaves. The 3 subwaves are more common, which means that every wave (1 -> 5) in this diagonal usually has 3 subwaves. As such, we are looking at subwaves 3-3-3-3-3 for this diagonal.
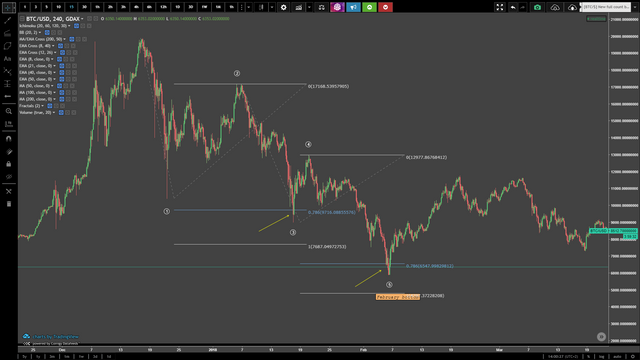
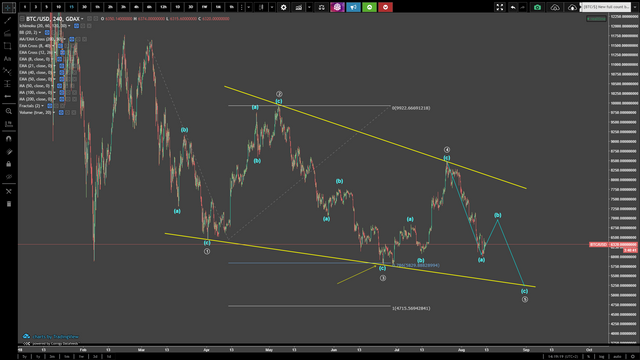
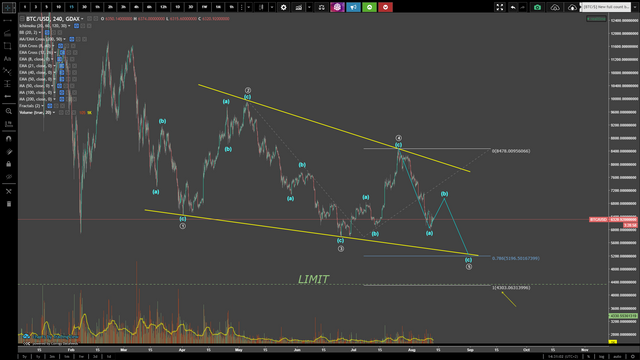
Let's attempt to fit a count.
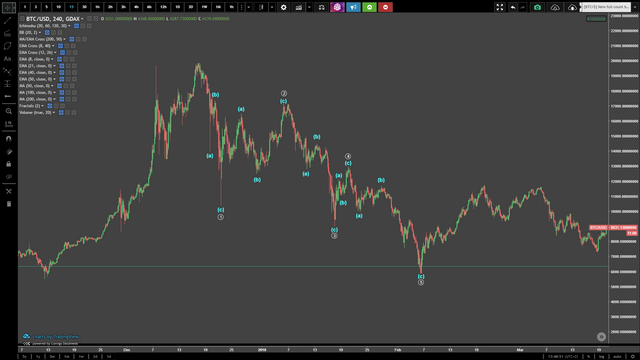
This clearly works, however let us measure some of these waves. Notice here how the measurement of the (c) wave relative to the (a) wave in both the 1 and the 3 line up to precisely the extension 1.272, which is the squareroot of Phi, the golden ratio (1.618). Now, why does this not work for the subwaves (a) and (c) of the 5th wave. This one is clearly longer than the 1.272 extension. Notice that there was a reaction at the 1.272, pushing price up and then an immediate reaction causing the price to head lower. This is called an overthrow.
Overthrows (or underthrows) occur in contracting patterns such as these:
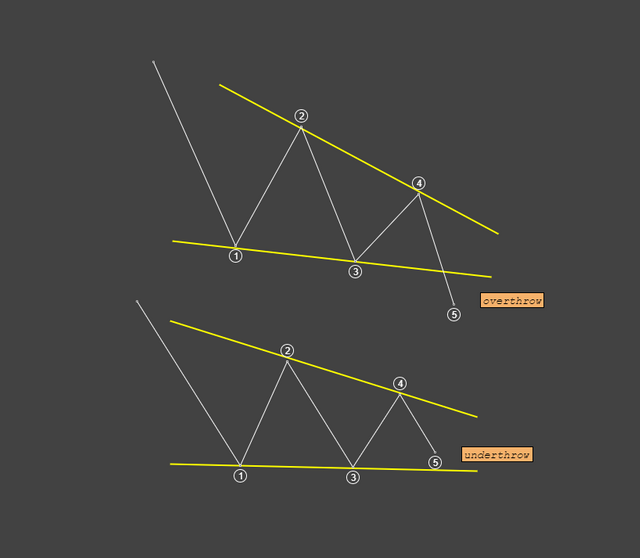
In this case, an obvious overthrow ensued, which was followed by a strong rejection in price, initiating a move upwards that would eventually halt around $11,800.
Let us now measure the numeric (1-> 5) waves relative to each other.
They show the same overshoot of the 0.786 extension. This is not a coincidence. The 5 ends exactly where the 3 ends relative to their corrective waves. This makes it a very credible diagonal. Diagonals often have one important ratio number, which can be a Fibonacci number but it does not necessarily have to be. The consistancy of the number is more vital.The only issue, I will say, is the duration of the 4th wave compared to the 2nd wave. The 2nd wave is so much longer (almost 5 times longer) than the 4th wave. Their retracements, however, are very much acceptable.
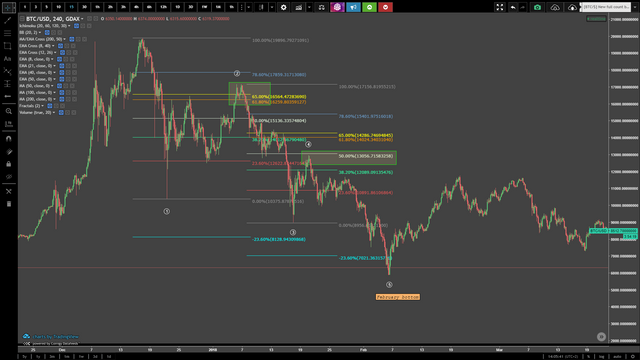
As such, a case can be made for a credible leading diagonal.
Building a case until the February high
Here, too, two potential ways of counting are possible. We are looking for a B-wave (with 3 subwaves, abc), so we can count in one of two ways; both are fine, and they do not change anything about the bigger picture.
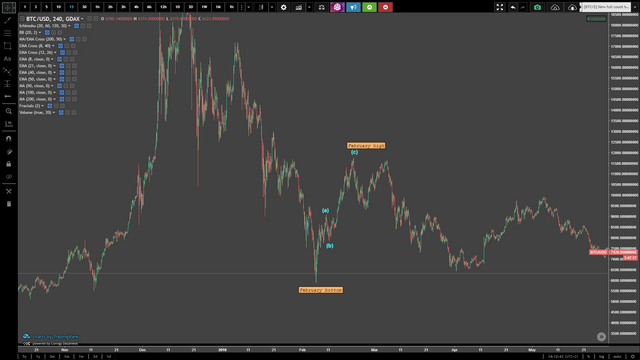
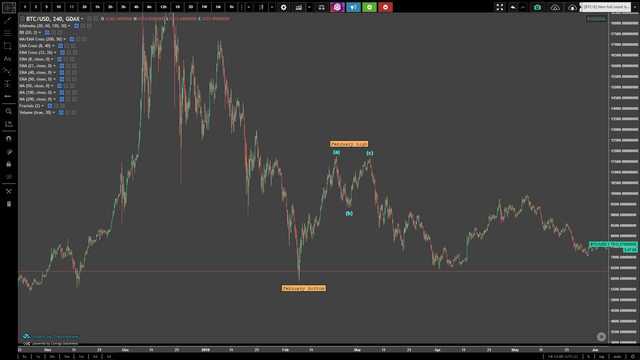
Building a case for the C-leg of this big ABC
Many attempts by analysts have been made to count this, but eventually most of them agree that the waves that have gone up (increasing price) are not impulsive (meaning 5-waves), but rather corrective (meaning 3-waves).
Could a case for an ending diagonal 1->5 be made here, with subwaves 3-3-3-3-3? Very much so.
Let's start with the wave ratios. A Fibonacci extension from the 1st wave to the 2nd wave projects the 3rd wave at the 0.786 ratio; almost to the tick. This is the same number that showed up in the leading diagonal.
Ideally, just like the leading diagonal, we would like to see the same number appear for the end-point of the incoming 5th wave. However, remember that it can undershoot or overshoot price. We will stick to the theory here and assume that it will land near the 0.786 and then try to use other tools to find out whether or not that is a valid strategy.
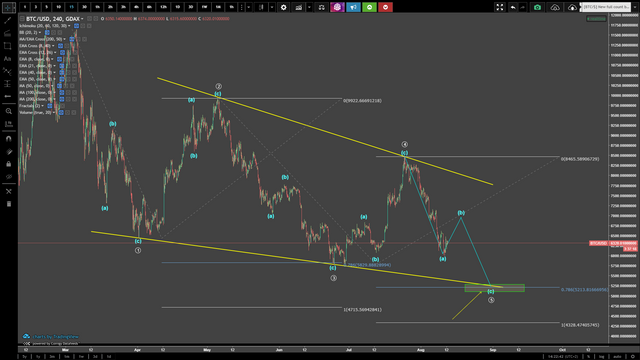
Now, what about the 2nd and 4th wave? Length of the 4th wave relative to the 2nd wave, again, shows us the extension 0.786 precision hit.
This builds a very strong case for a textbook diagonal.
Diagonals are contracting patterns, which means they form between two lines that shape a triangle. Volume is supposed to decline as price reaches the apex (end-point) of the triangle. In fact, in our scenario, it clearly does. What we will be on the look-out for is a spike in volume as the final sell-off ensues near the end point of this diagonal, i.e. between the (b) and (c) subwaves of the 5th wave.
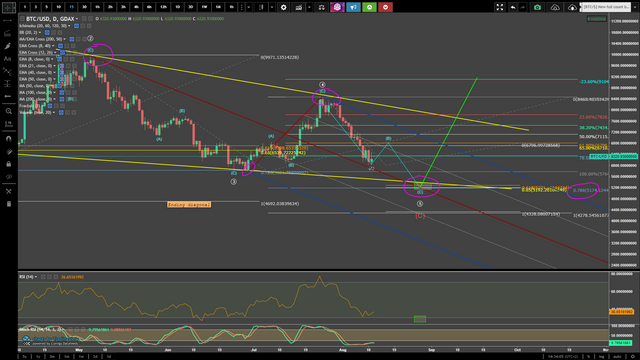
Vital to the formation of this ending diagonal, is that the 5th wave must be shorter than the 3rd wave. Practically, this translates into the simple fact that price cannot reach or decline below the 1:1 extension point as shown below. This would invalidate the entire C-leg ending diagonal. As such, the limit for the potential overshoot of the 5th leg is as drawn here:
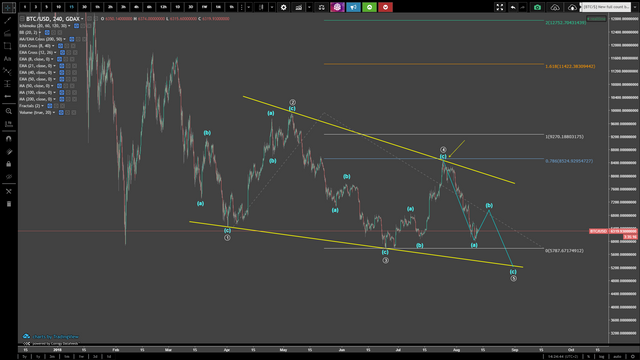
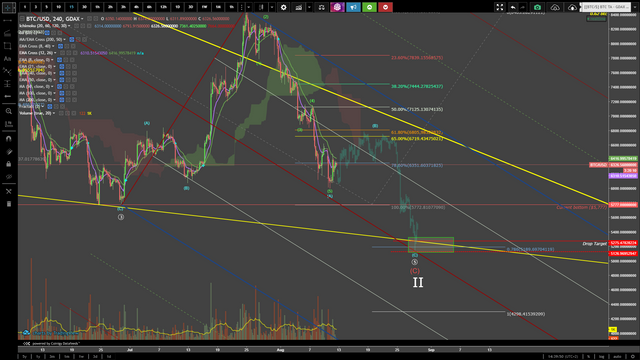
Lastly, I would like to show you the current pitchfork that price may follow. Highlighted in magenta are the start of the pitchfork, its two sides, the median line hit with the 0.786 and said 0.786 extension that was mentioned earlier. Combined with the RSI, an expected buy target in time would be as shown below visually by a green box; though, remember, if an overshoot ensues, this target may be slightly off because this is the theoretical target. The hard limit is around $4,328 depending on the Exchange where Bitcoin is traded. This is the hard limit (1:1 extension) as referenced earlier.
The full count would then be as followed, where this ABC can be seen as the 2nd wave of a major uptrend for Bitcoin, with the 1st wave ending at $20,000.
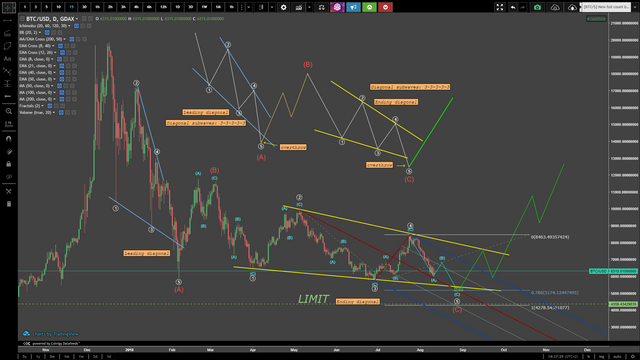
Potential roadmap for price:
Thank you for reading and good luck trading.
Arch
Congratulations @puppycoins! You have completed the following achievement on Steemit and have been rewarded with new badge(s) :
Click on the badge to view your Board of Honor.
If you no longer want to receive notifications, reply to this comment with the word
STOP