[27/02] [CORE POST] Extremely in-depth view of Bitcoin's past and current price action, and technicals [Educational]
History
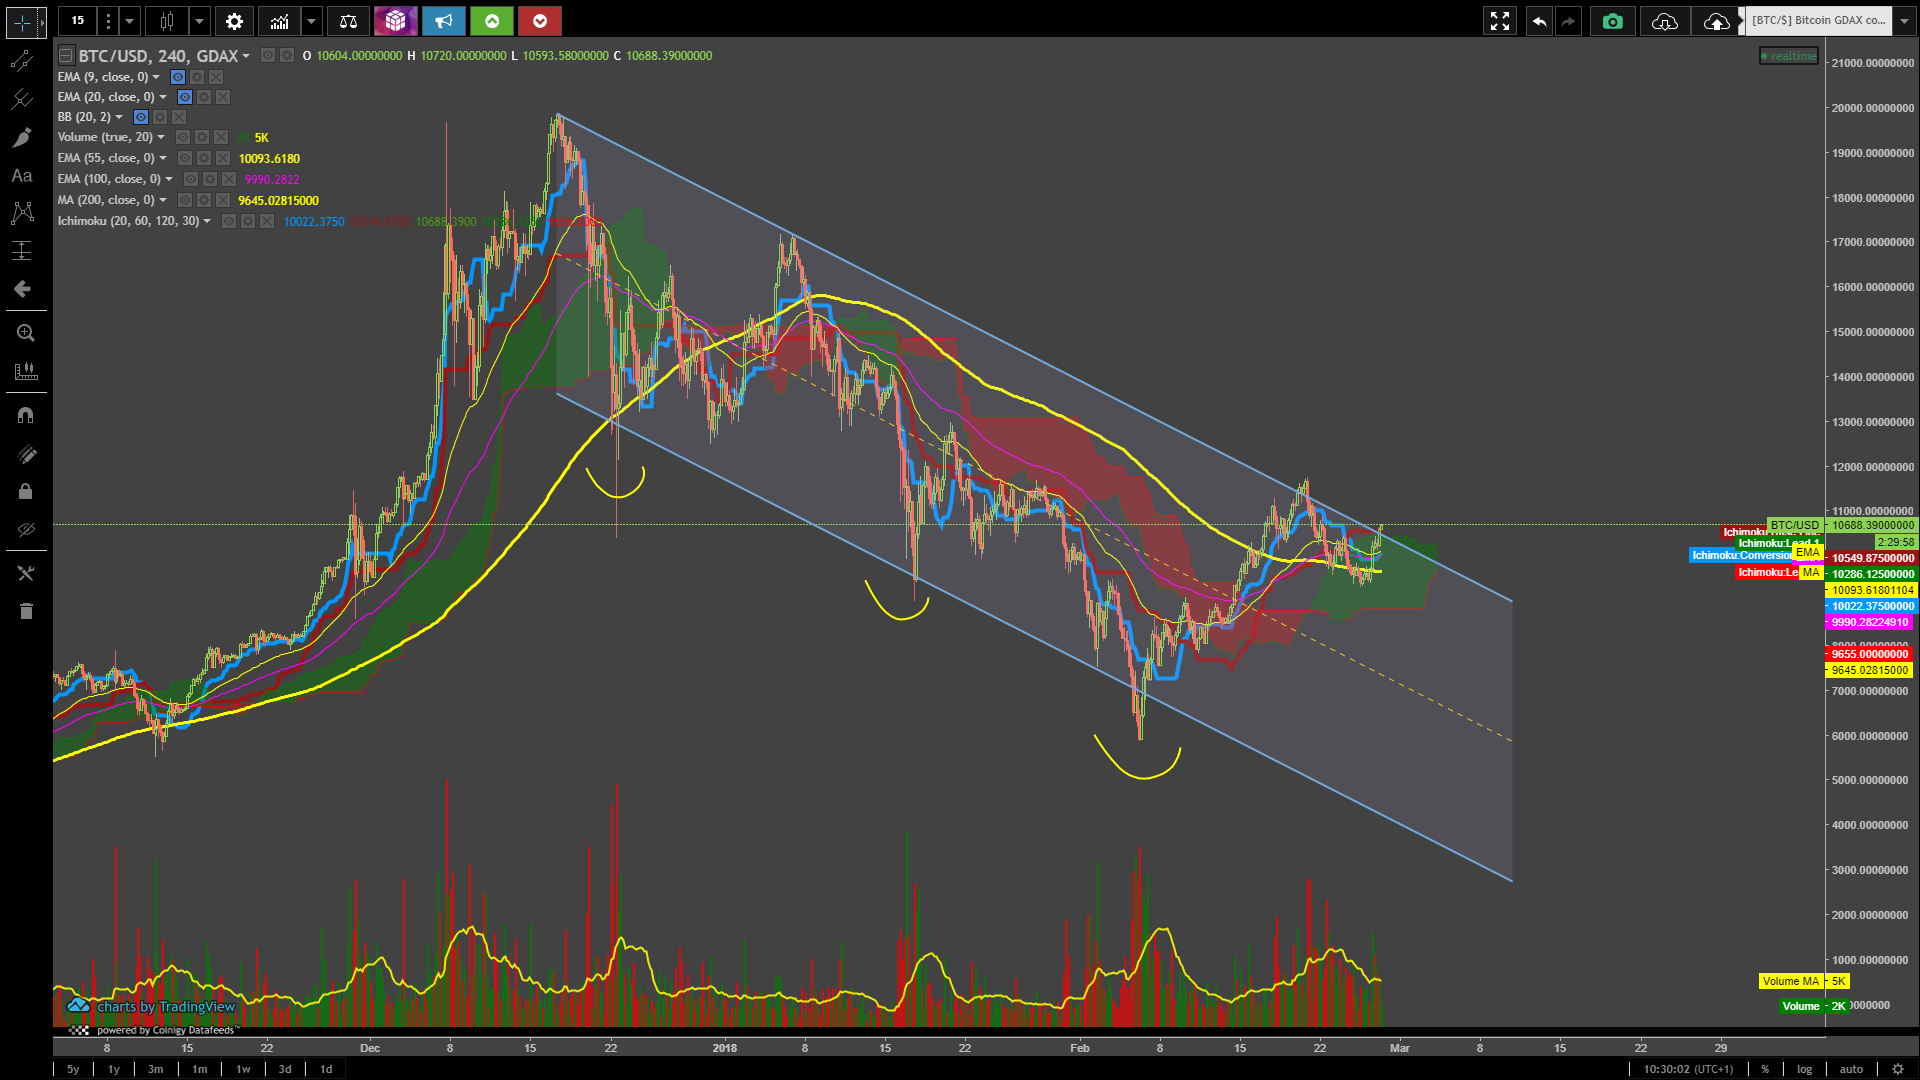
First and foremost, a few initial comments on the high timeframe view of Bitcoin. January 2018 produced a descending channel, which Bitcoin respected quite well. Highlighted in yellow are some wicks that penetrate the channel. You will notice that these do not always appear on all Bitcoin charts, but rather depend on the Exchange used in your Technical Analysis (TA).
These wicks are often due to panic selling and the so-called snowball effect, but could very much find their origin in the fact that the Exchange used has low levels of liquidity, meaning price can move exetremely fast (down or up) because there is not enough Bitcoin to prevent it from falling or rising. Liquidity is essential in a market, especially when doing TA, because else you will end up having to consider many long wicks; the latter problem can end up causing you to draw supports or channels which actually should be drawn differently in reality. I have drawn my channel in such a way that I acknowledge these long wicks, but do not trade off of them (mainly because of their skewed nature).
I will not go into extreme detail, but Bitcoin's bottom is most likely in. The correction itself is of complex nature and can be counted as a WXY-correction, each wave consisting of 3 subwaves, as shown below. The correction itself (@haejin) is subject to the highest degree trend wave 2, which I will refer to in my blogs as simply 'Two' (annotated with large Roman numerals).

A few comments (which no longer matter, but are interesting for the sake of TA):
1/ The W-wave should consist of 3 waves, but can also be counted as a 1-5, as I have shown here. Because of the shallowness of the (2)-wave, one could argue that better TA should dictate subvision of the W-wave into an ABC (three waves).
2/ Likewise, the X-wave (which signifies a failed impulsive uptrend), consists of 3 waves, ABC. Ideally, the A wave should have 5 subwaves, but it is virtually impossible to count it this way. 3 subwaves fit this count perfectly. I remember noticing this when it first developped (as did @haejin) and this could have tipped us off to the fact that an X wave was in the making.
3/ Because of the nature (subwaves) of the W and X wave, one could argue that this entire correction could be counted as an ABC zigzag. Unfortunately, that indicates that we should see 5 waves in the C-wave (annotated here as Y). We did not, yet we do see a 3-wavish structure, confirming to us that WXY is indeed the correct way to count this major correction.
Currently
The below blank 4H chart shows excellent activity throughout the whole of February in terms of volume. We have found support (on a larger time frame) on the 200SMA (thick, yellow MA) and continue to move within the green Kumo cloud.
The chart below is still a 4H chart, but zoomed in to the current price action. Ichimoku clouds have two main indicators for price movement: Tenkan (blue) and Kijun (red). Ideally, you would want the T(enkan) to be above the K(ijun). Notice how the T has begun curling upwards. This signal is especially valid on high time frames and in uptrends.
Additionally, we have pierced Two's upper channel trend line. If we want to count this as an uptrend, it is vital that retest this it from the topside and bounce off of it.

I use 3 technical indicators to confirm Elliott Waves and Fib levels:
1/ RSI
2/ Stoch RSI
3/ MACD
These help us discover market strength and movement. Let's firstly look at why we have decisively put in the first wave of a new uptrend and as such have put in the bottom. Pay attention to the magenta circled zone only.
We can count 5 main subwaves (i,ii,iii,iv,v), each with their own subwaves (yellow (1)->(5) for trend related waves, ABC for counter trend related waves). An excellent ascending, bullish channel was formed in which this first impulse wave up had moved. The 5th major subwaves was slightly short, but still valid. 5 subwaves could be counted (I have added in a few deeper counts, too).
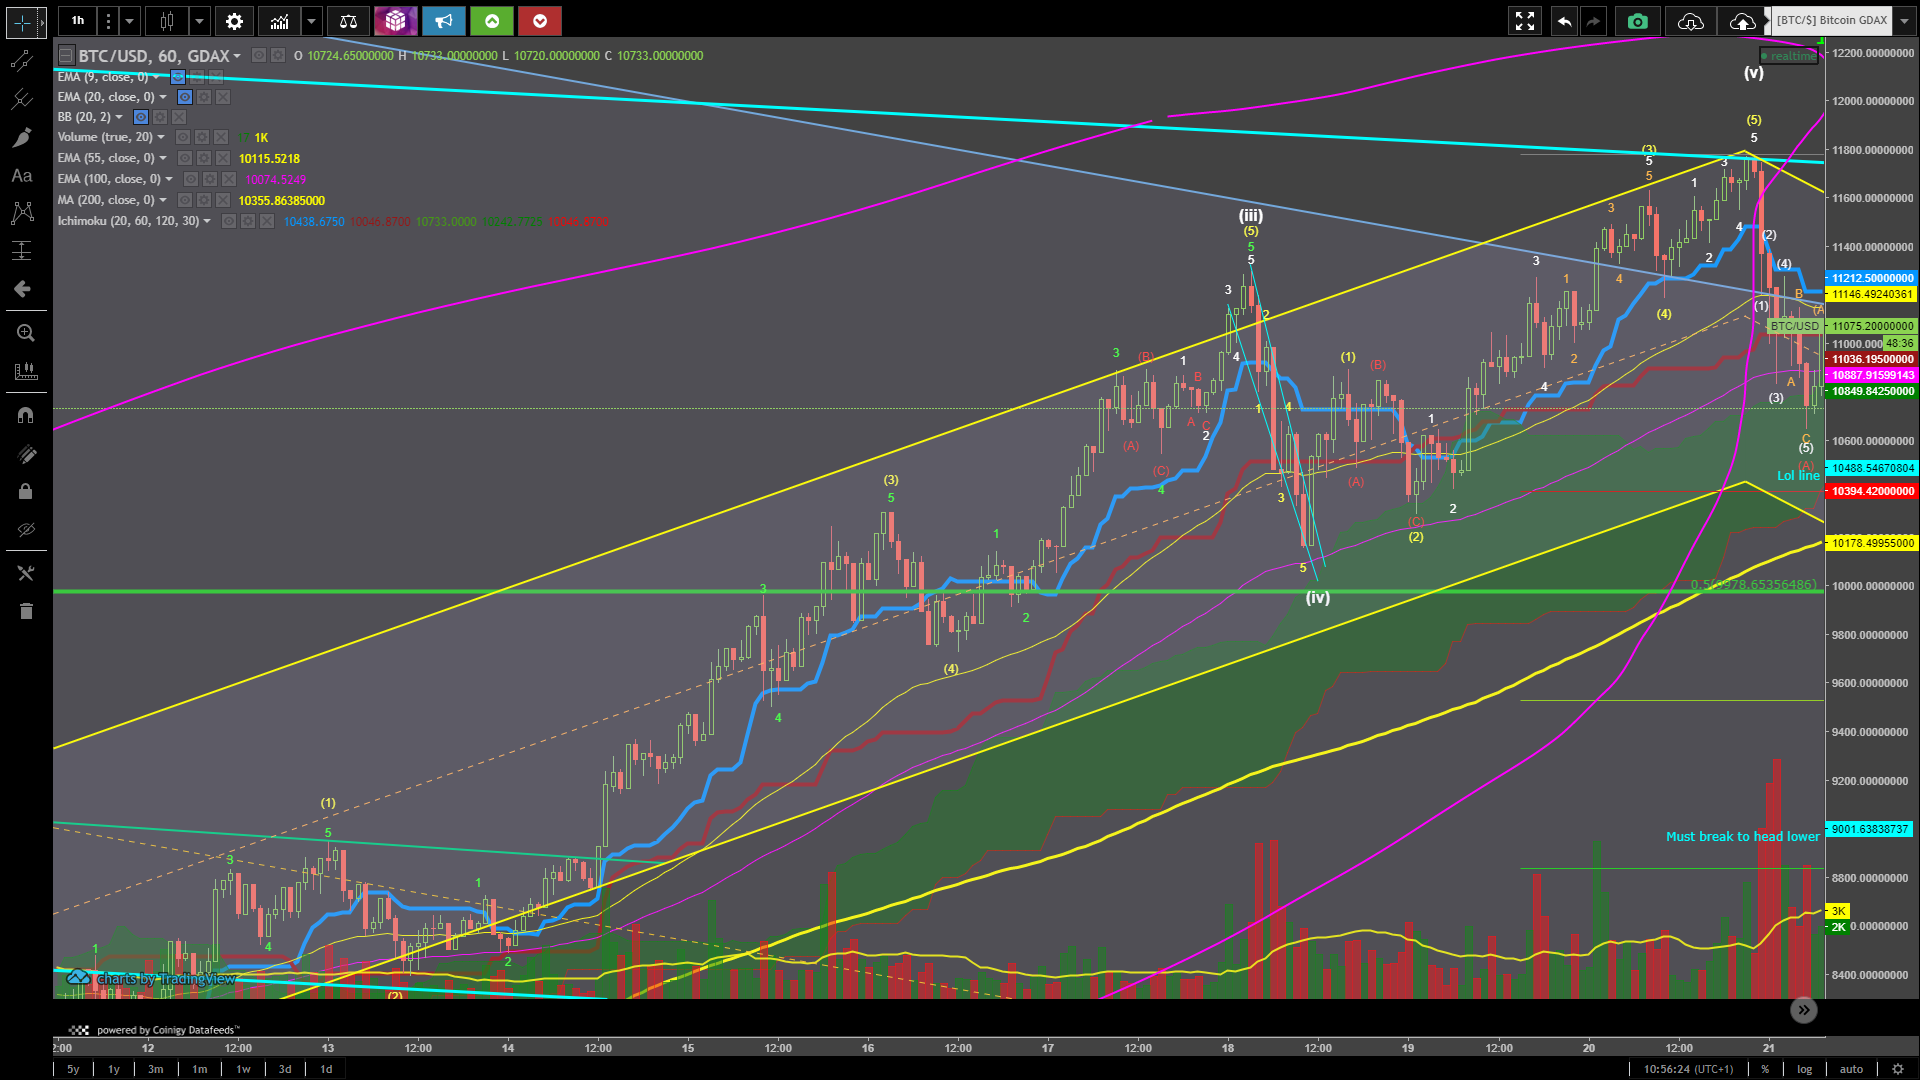

The current wave 2 and potential wave 3
The wave 2 correction is extremely complex in nature and could still play out as a bull trap. I will argue both sides in such away that you will have been informed in an unbiased manner. First, my initial count before yesterday's break-out:
Hypothesis: wave 2 is of corrective structure WXY and acts as a fractal to the 'Two' wave of highest degree. The current uptrend (disregarding news for a few minutes) is a bull trap and we are putting in an X-wave.
Old count
I had begun counting waves as WXY (3-3-3 subwaves), mainly because if you count them as a Zigzag (ABC, with subwaves 5-3-5), you will end up overlapping (1) and (4) in your A wave, as highlighted in magenta. I have labeled every subwave (feel free to have a closer look by opening the image in a new tab) in such a fashion that is would respect a WXY (with smaller subwaves WXY, ABC, WXY). This count was invalidated overnight, due to price crossing the cyan Invalidation line. The expectation was that it would input the yellow Y of the green Y leg and hit the 1 to 1 ratio in regards to the length of the large W and large Y waves. This would also have put price inside the golden pocket (0.618-0.65) in terms of the retrace of wave 1 ( this would have then meant that wave 2 = wave 1 x 0.618, which has a high probabilistic chance). This did not occur.

New count?
Let's continue to entertain the idea of the bull trap count and count these waves slightly differently (still as a WXY), as shown below. The Fib levels to the right indicate Fib extensions for the Y-wave in regards to the W and X waves. The Fib levels in the middle indicate the retrace levels for wave 2, in terms of wave 1.
The main reason why this is still an option is because the 4H stoch RSI is still extremely overbought. This is a huge concern.

Even worse, the Daily stoch RSI is not bullish at all either. Notice that when the Stoch RSI is declining from the overbought region to the oversold region, it turned ONCE in the whole of 2017 and went back up (circled), whereas every other time, we had a decline to the oversold region first. Granted, although its rare nature, it did occur once.

Current price action does show a cross which could leads us to believe that we may indeed be in said rare occurence. This latter observation entertains the bullish count, which I will discuss in my next blog along with the bullish count.
I leave you with this: in the short term, we should see a brief decline in price either way we count this. $9800 would invalidate the bullish uptrend and would indicate that this WXY is still in play. For the bullish count (which I will discuss in my next blog) I would buy anything between these magenta lines:

Wow its a great post ever!