$OMG Price Analysis: Don’t Get Fooled Edition
$OMG Price Analysis: Don’t Get Fooled Edition
The reason why this price analysis is called ‘don’t get fooled’ is because you could get fooled if you’re not careful.
OmiseGo on the H4
https://www.tradingview.com/x/nIRY8hAW/
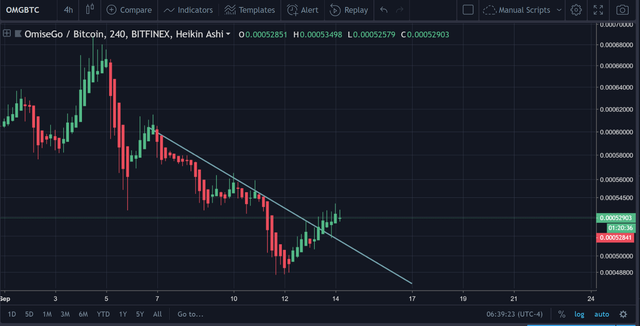
In the picture above, we can see that there was clearly a defined downtrend line spanning from September 6th to approximately September 13th (the day that just passed); so, not a major point of transgression.
https://www.tradingview.com/x/kwKgNtlJ/
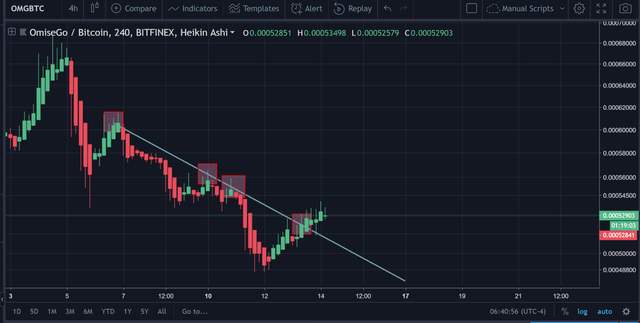
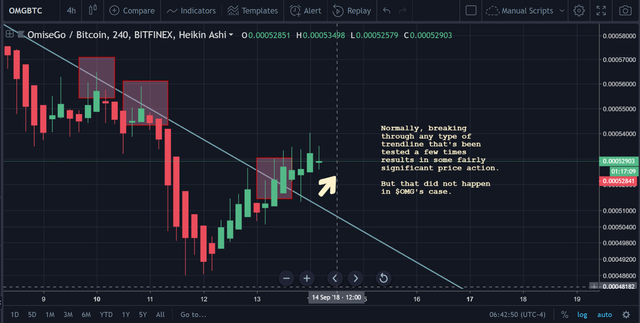
Now, the price did break above, but it wasn’t as substantial as one would like it to be in order to generate a solid buy signal.
https://www.tradingview.com/x/MhNhHwpg/
https://www.tradingview.com/x/8Er062PR/
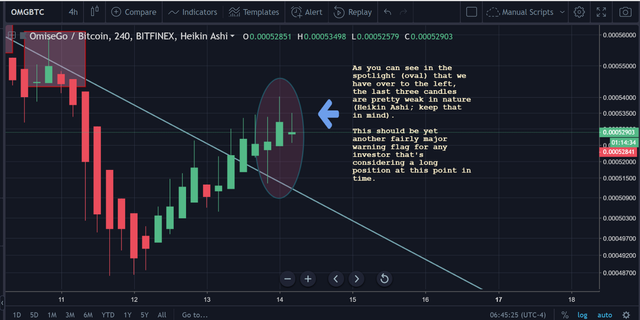
The two pictures above should make it abundantly clear why traders should already be leery on placing a long position in the coin at this point in time.
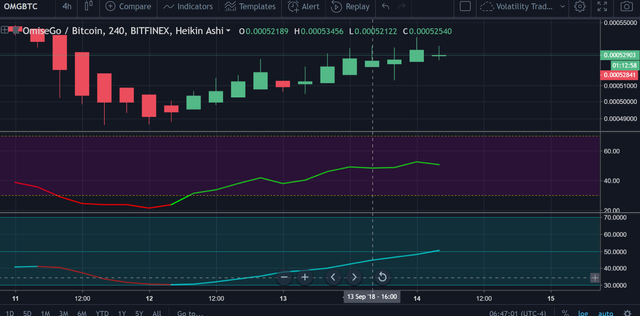
RSI for $OMG on the H4
https://www.tradingview.com/x/fKnloNlV/
The RSI for $OMG is looking very stagnant at this present moment in time.
Could easily tilt over and provide a lower low than the last one and really just break the phase/trend that it’s in entirely.
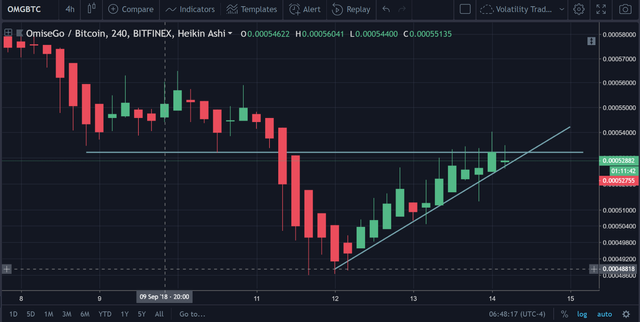
Flat-Top Triangle Formation
https://www.tradingview.com/x/1LxXhQ0w/
The flat-top triangle pattern formation looks fairly obvious from the H4.
However, with the way that $OMG is looking right now, its very plausible, if not likely, that the price teeters over very soon.
Sure, there is a chance of a break upward of north, but the author really feels that south is where this is headed.
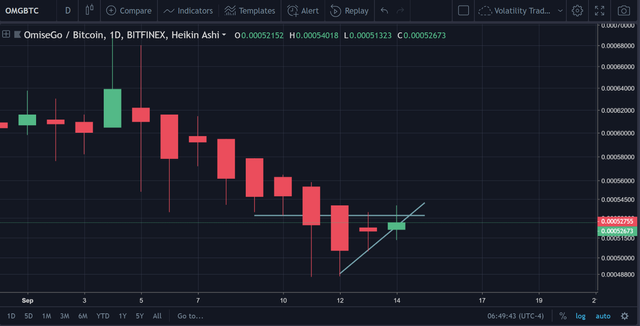
Daily Looks VERY Bearish for $OMG
https://www.tradingview.com/x/vnPObfY1/
The daily really looks as though the price of $OMG broke through a fairly important support point, started bleeding for a little while and now the price is back to touch that support point before potentially continuing its descent downward.
Conclusion
In the absence of any solid evidence to show that there is going to be a major reversal in the price, this looks like a clear abstain in the opinion of the author.

