OmiseGO Price Analysis
OmiseGO Price Analysis

I know it’s a stock photo; don’t care
Disclaimer: This article is not financial advice. The author is not a financial advisor and this article was not paid for.
For more information like this, join/follow our Telegram, Discord, Steemit, Reddit, and Twitter!
OmiseGo Price Analysis
Let’s take a look at $OMG and see what’s it’s been doing as of late.
https://www.tradingview.com/x/oxWMlA8S/
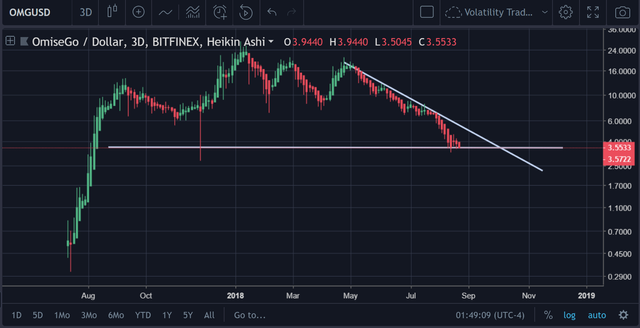
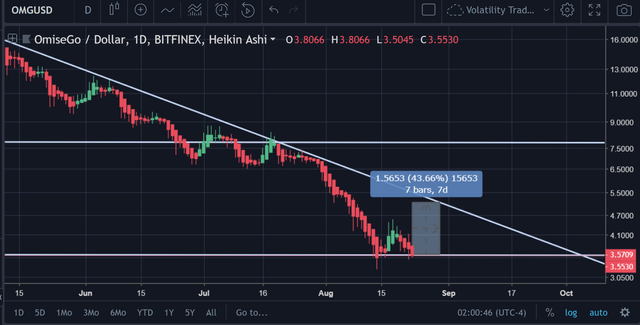
Above is a view of $OMG on the 3-Day chart.
To say that the support line that I drew horizontally across the chart that you see above is strong in any way, would be an overstatement.
However, if you look closely, it does appear as though the price has failed to move the price below this level. Although, it’s relatively untested and there are no indicators that appear to give any signs that things will be changing anytime soon.
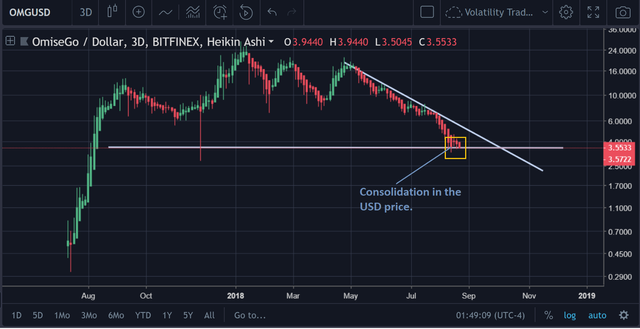
It appears that once the price through the long-term $7.50 support that was holding (it’s the overhead resistance now in the chart that you’re currently viewing if you’re following along on TV).
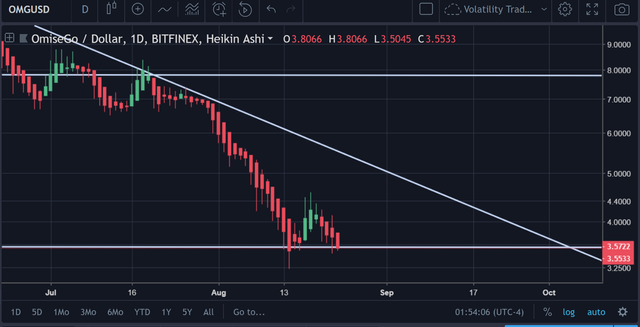
Let’s Zoom in to the 1-Day Settings
https://www.tradingview.com/x/zuHr4tVZ/
When you look more closely at the 1D settings, you can see that the price of $OMG, is indeed at a support point.
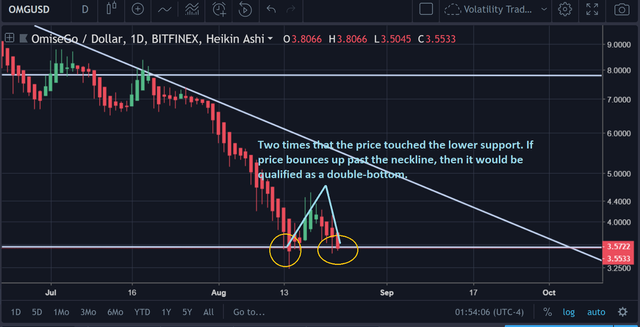
Once again, this is only the second time that the price has tested this support, so there isn’t really enough credence to suggest that it’s strong other than its apparent repelling of the price after that zone was hit. ‘
The touching of the support twice before bouncing (slightly) on the second test shows a potential double-bottom play evolving in the future.
Let’s throw on a Fib chart and see if we can gain anymore information that way.
Potential Gains
The downtrend resistance that is directly overhead from where the price is right now, represents a 43.66% appreciation in the price:
https://www.tradingview.com/x/pHKtSc3a/
However, this is far from a guarantee.
If the price falls through the support that it is at currently, then $OMG holders would be screwed.
Fibonacci Chart
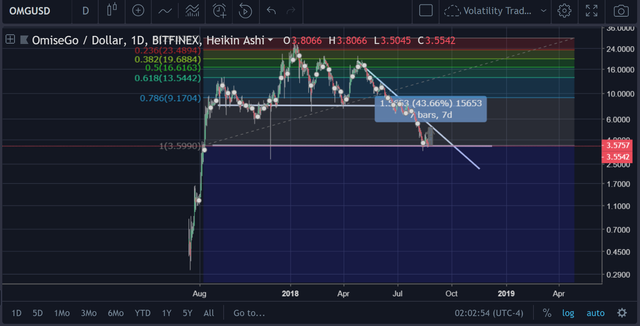
https://www.tradingview.com/x/xUUuW43c/
If we draw the Fib chart where the ‘support is at currently’, which assumes that $3.50 is the 100% retracement point, then we get a solid visual of the chart for users to check out ^^.
Currently, it has no major bearing on the price.
Conclusion
$OMG could be due for a bounce soon.
However, this is far from guaranteed; so we need to make sure that we set a solid R/R on this, because a break through this support point could seriously spell disaster for holders.

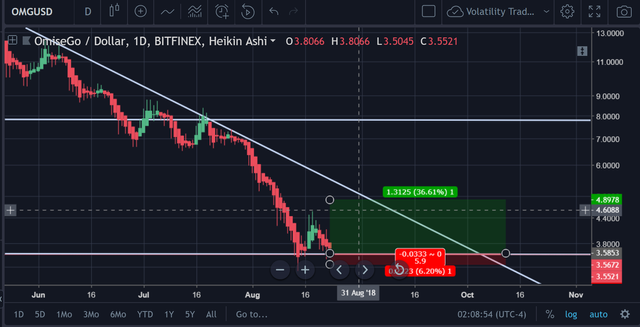
Juicy R/R on this trade here.