Monero Price Analysis: Bounce Possible
Monero Price Analysis: Bounce Possible

Disclaimer: This article is not financial advice. The author is not a financial advisor and this article was not paid for.
For more information like this, join/follow our Website, Telegram, Discord, Steemit, Reddit, and Twitter!
For those that have been following Monero, you’ve probably noticed the extraordinarily bullish sentiment that has taken hold of the protocl in recent weeks.
There are a few reasons for that:
- On a technical trading level, Monero was looking delectable. Period.
- There was a report that came out that valued Monero somewhere in the upper reaches around $40k at some point in the near future (which is a few hundred/thousand percent above where it is currently).
- Monero is a solid project in general and things that are fundamentally solid in any market, with awareness and marketing behind it are never going to die — even when we’re in a bear market.
Now that we got those facts out of the way, let’s get to the actual price analysis itself.
Monero Price Analysis (Daily TF)
https://www.tradingview.com/x/XIu5PVi5/
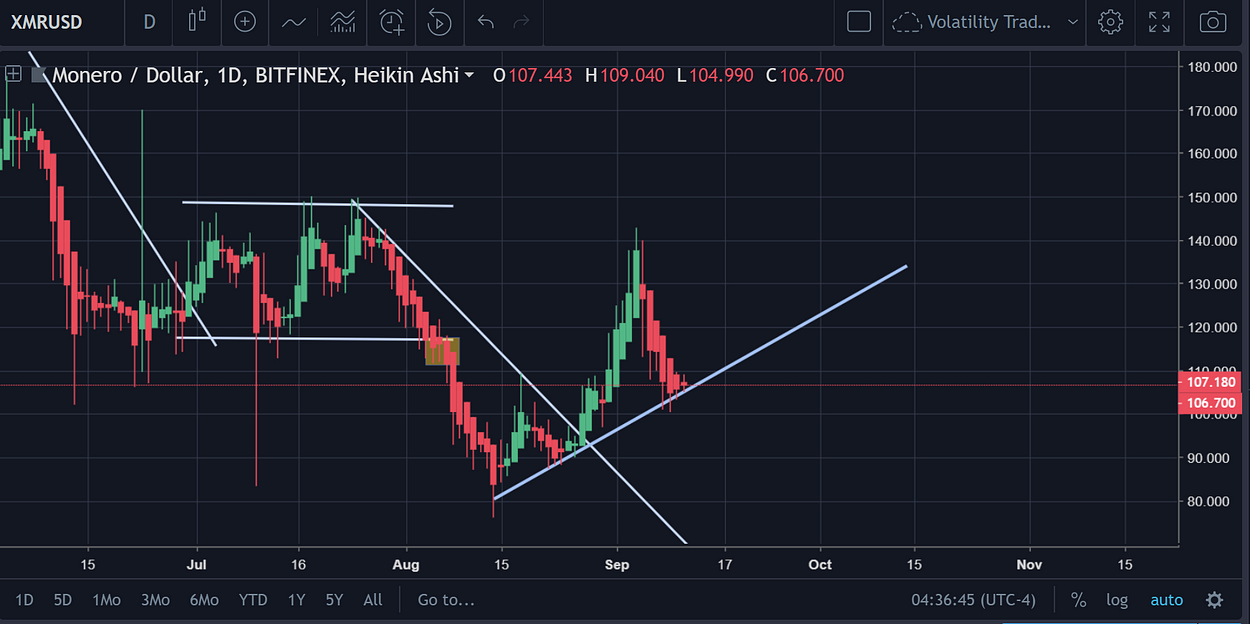
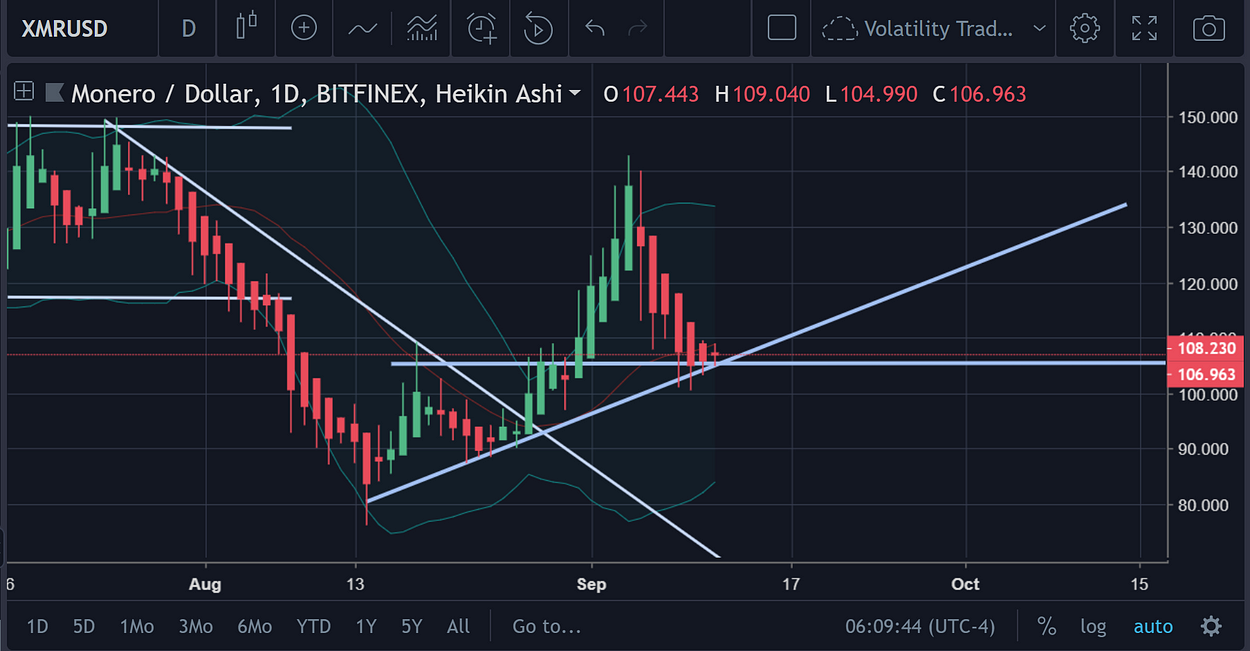
From the chart, we can see a break above the baby-symmetric triangle (which resulted in a reversal), into a couple of bounces that eventually let the price start jumping out of the gym before touching back down to earth (where it is now).
If the mini-uptrend on the daily chart holds, then one should expect that the price will be increasing for Monero at any point now.
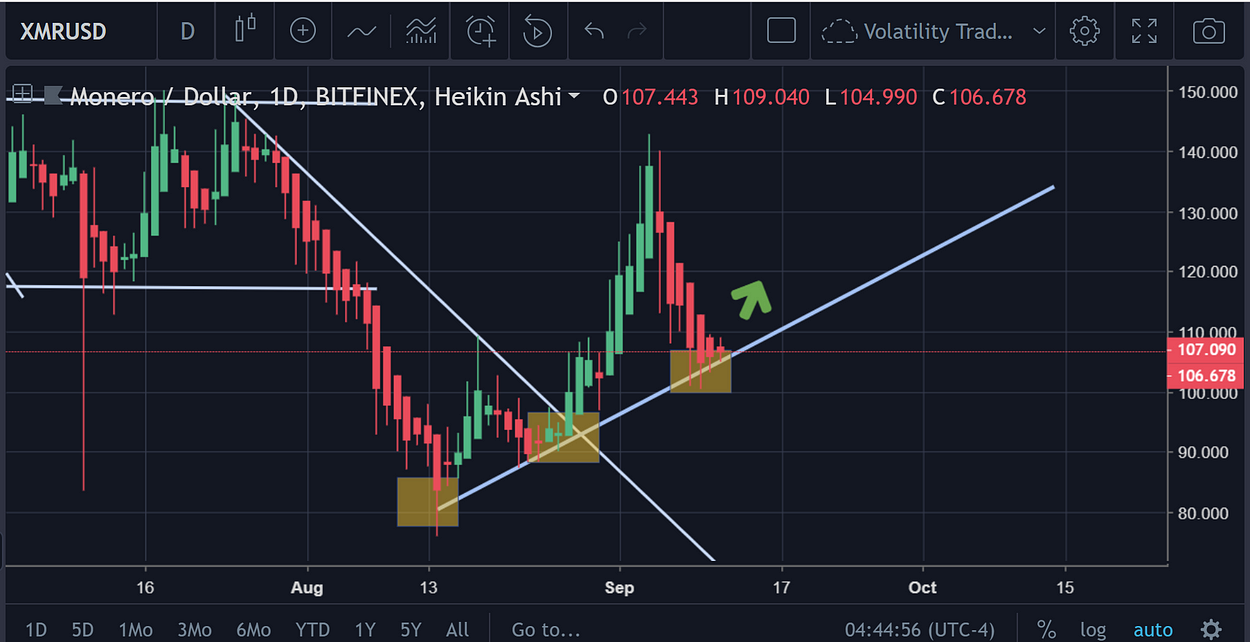
Below, is another illustration of the chart to help traders get a better visual of what’s going on:

https://www.tradingview.com/x/Qt5VrcFT/
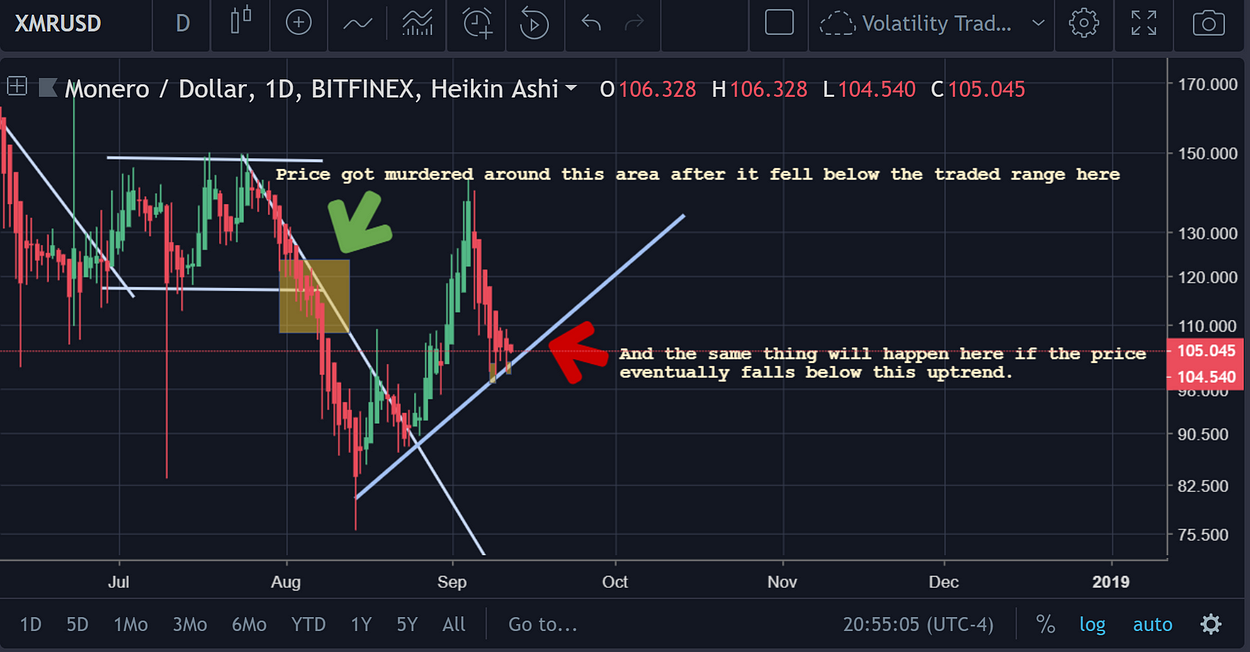
https://www.tradingview.com/x/MzxnNC98/
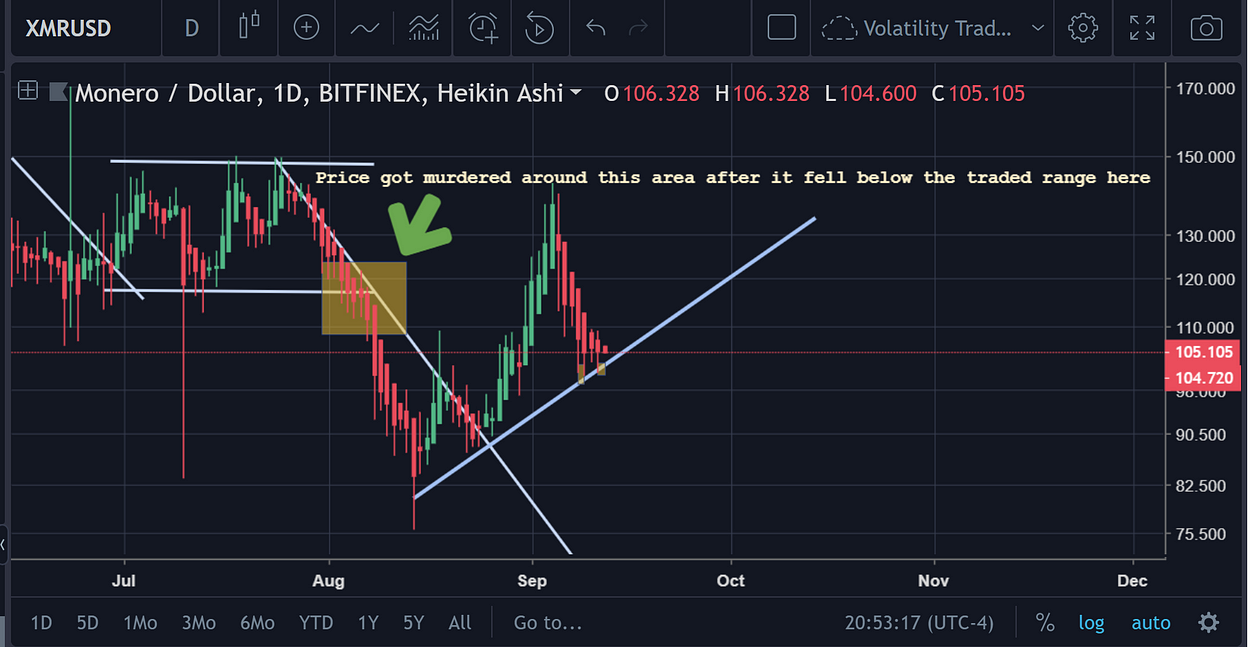
If the uptrend were to hold here, then the green arrow should symbolize where the price action will head to in the future.
But we can not just take this at face value!
This is crypto, and the price could just as easily break back down below the uptrend line.
There are a slew of negative price signals on the daily
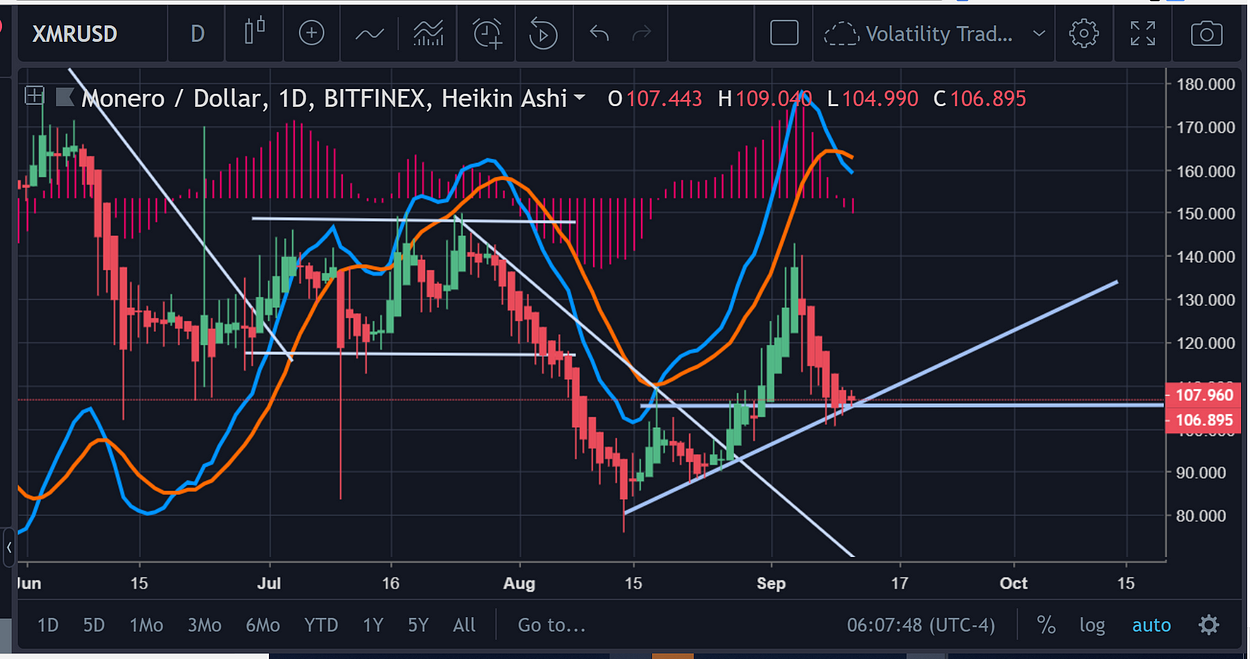
EMA ( Exponential Moving Averages )

https://www.tradingview.com/x/JdDdqJxG/
Burnt Orange = EMA-26
Lime Yellow = EMA-12
Looks like the EMA-12 may be headed down below the EMA-26, which would be bearish and the price has already crossed below both EMA indicators, which is bearish in itself. So, this is something to watch for.
However, it must be noted that the exponential moving averages are lagging indicators.
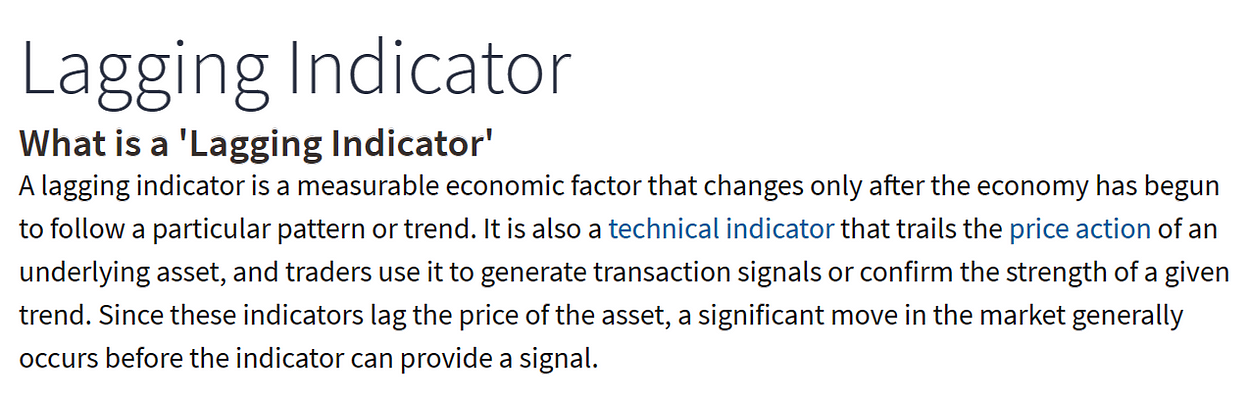
Source: https://www.investopedia.com/terms/l/laggingindicator.asp
MACD (Moving Average Convergence Divergence) Indicator
https://www.tradingview.com/x/0tGiJ1Nv/
This is the MACD overlaid on the main chart.
Its a bit messy, but you should still be able to clearly see the bearish cross of the MACD as well as the negative Histogram just getting started and the current bar is bigger than the last, and it also looks like the bars have just started on the negative side too — so, it looks like there’s no waning on that situation coming anytime soon.
Bollinger’s Bands
https://www.tradingview.com/x/lzEQtbnd/
Price isn’t even at the bottom of the Bollinger’s Bands on the daily. No bounce in sight.
(Continued on September 11th, 2018)
Let’s Go to the 2 Hour
https://www.tradingview.com/x/tmcnFyDr/
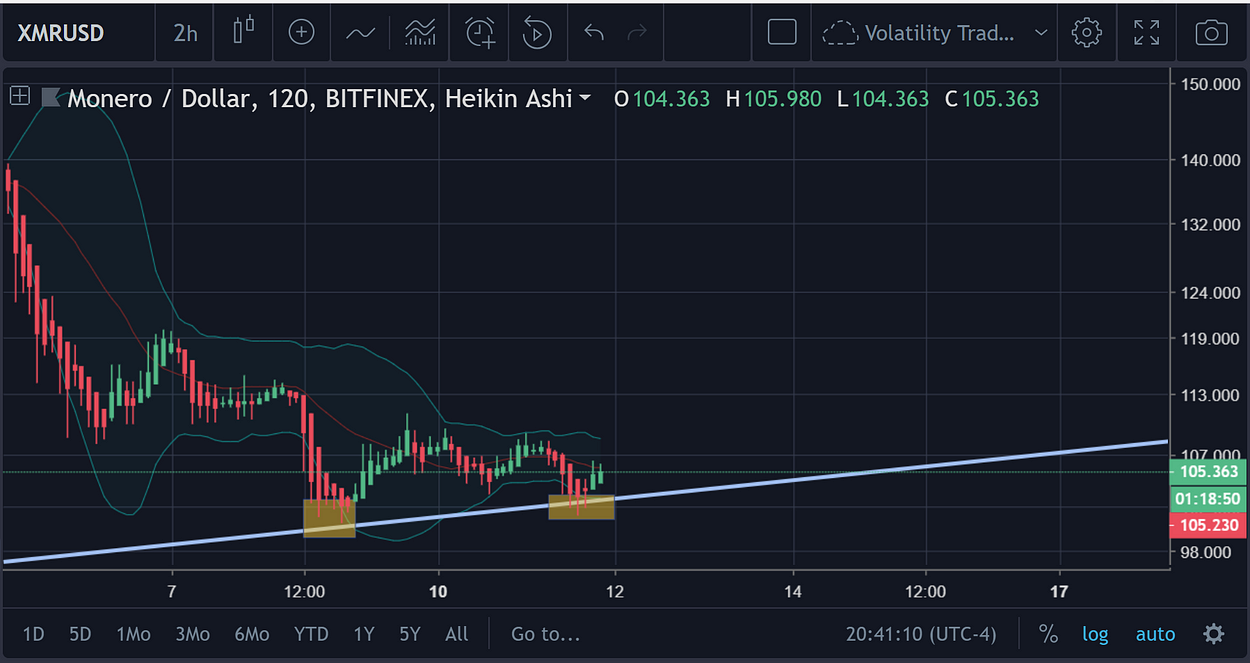
As you can see in the photo above, the uptrend appears to be holding fairly and we can see a slight bounce off of the trendline at the end.
The yellow squares that you see are indicative of the touches on the trendline (please note that this does not need to be an “exact” touch, just within the general realm/region).
RSI(14) on the 2H
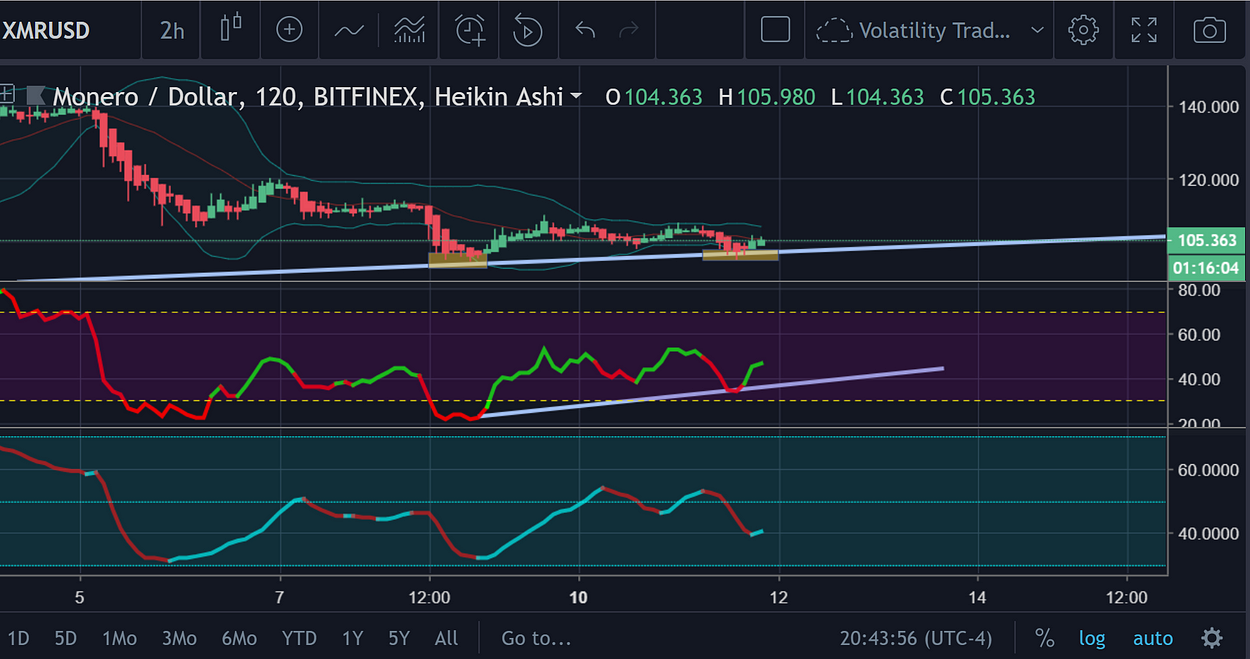
https://www.tradingview.com/x/IE8SP77N/
Truthfully, the RSI is a bit iffy here, but it does appear to be on its way up.
XMR’s fate will probably be decided, in large part, by the performance of the crypto market in general.
If the crypto market s**** the bed at some point in time, then yeah, it’s most likely that the price of Monero is going to plummet with it. While it has been defying the market trend over the past month, it has not been entirely immune to downward moves.
For the most part, Monero has been on the move while Bitcoin/crypto markets are moving sideways/going up. But when the market is headed downward, it has generally been consolidating as well (we can even observe this phenomenon on the charts now).
However, the fact that the uptrend line has held so solidly is fairly indicative of the fact that it is proving to be a reliable point of support for the price. But, a break below this could lead to the same disastrous drop in price that we had seen before.
https://www.tradingview.com/x/zhfrKxUX/
https://www.tradingview.com/x/Te4R780j/
The two pictures above show the inherent risk to traders if they are “wrong” about their long decision.
Conclusion (Strategy Advocacy; Not Financial Advice)
If it were left up to the author’s hands, and they were resolute on making some sort of play on Monero, then the best play would probably be to wait.
The author is unsure about the liquidity of shorts on Bitfinex’s platform, but if the price does break down below the uptrend line that it is on, then Monero would be an excellent short. That’s something that most readers have probably gathered at this point.
A price where this breakage below the uptrend would probably be most ‘apparent’, would be at $100. Or, one could wait until there is another massive decrease in the markets, and make sure to short a coin like Monero, because it is more than likely that it will finally depreciate like the rest of the market once it has finally broken its uptrend.
Conversely, if this does not happen, then a tentative long position should be placed at the next resistance point that gets broken.
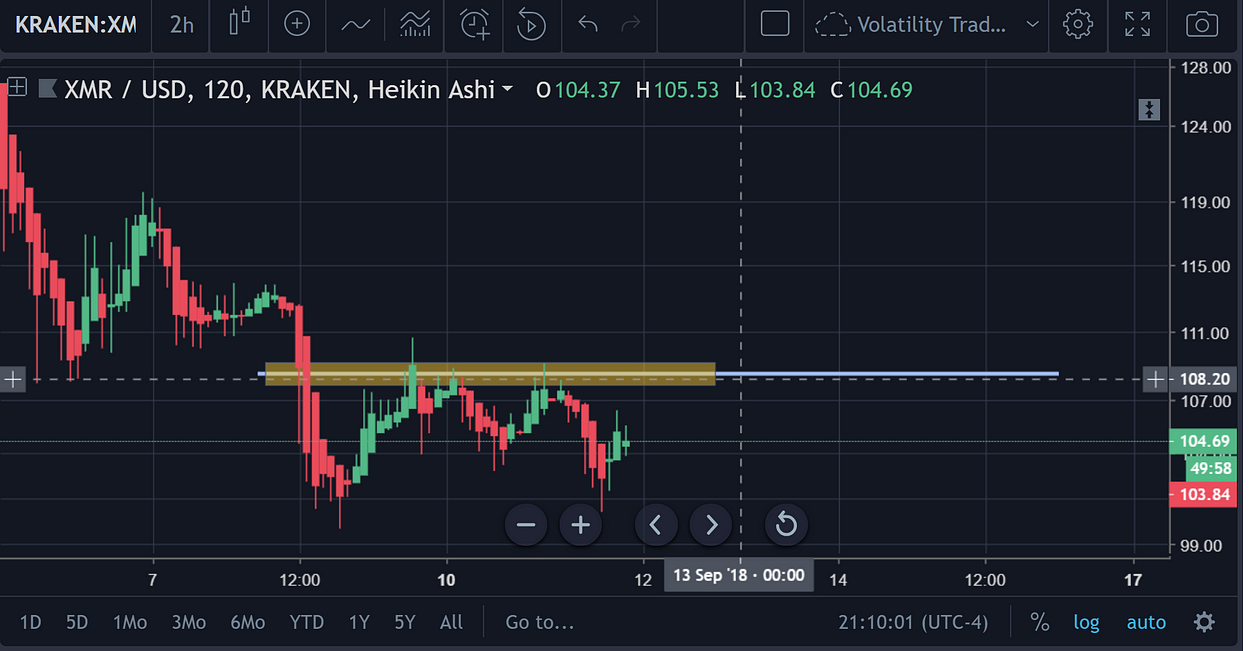
https://www.tradingview.com/x/GjZV6LHP/
It’s fair to assume that the next notable resistance point for Monero is hovering in the $108-$110 range.
This resistance point was determined by looking at the top of the range that Monero is trading in.
Thus, if the price breaks above the point where Monero is at currently, it would be most prudent to place a long position there and then place a S/L just below the resistance point.
Placing a long where the price is at currently could be really risky, even if you have a solid S/L on the market because a dramatic reduction in price could lead to your S/L not being fulfilled at all. And such an event is much more likely to happen in the wake of a major sell off or decrease in price (which tends to happen when price breaks below a trendline).
In either case, be safe trading!
All Links to the Monero Price Analysis
Website: https://zerononcense.com/2018/09/12/monero-price-analysis-9-11-18/
Steemit: https://steemit.com/bitcoin/@proofofresearch/monero-price-analysis-bounce-possible
TradingView Idea: https://www.tradingview.com/chart/XMRUSD/xeuy8OUz-Monero-Price-Analysis-Feast-or-Famine-Version/