Ichimoku Cloud Explained Thoroughly + Debunking Ichimoku Myths
Ichimoku Cloud Explained Thoroughly + Debunking Ichimoku Myths

The purpose of this article is to teach you about the Ichimoku in a more thorough way than what anyone in this entire cryptocurrency space has bothered to do. This article is also being written for the purposes of proving some haters wrong, because that’s what I tend to do best. Thanks.
If you find this article/information helpful — there’s way more where that came from (for free) at:
Telegram — t.me/CoinEducation (free Telegram channel — help links/analysis/news/insights 24/7)
Twitter — www.twitter.com/cryptomedicated
Be sure to leave me some claps and spread/share to all your friends so that I can continue to produce these articles for free!
Introduction
What inspired to me make this article was the fact that a lot of people were coming to me telling me that my Ichimoku settings were “wrong”.
They were saying that because I was using the ‘default settings’ from TradingView.
I’m going to go ahead and show the ‘default settings’ on the Ichiomku Cloud, then shell out what each of them mean, and show some different variations and what results you’ll get from tweaking each facet of the Ichimoku indicator as well as some neat ‘TV hacks’ you can use to optimize it for specific situations that you find yourself in while trading.
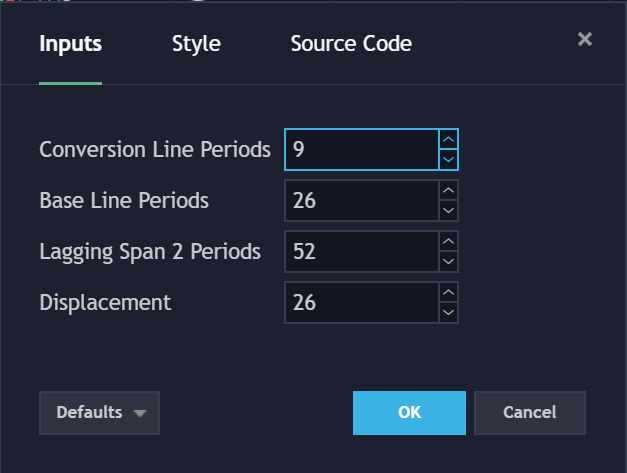
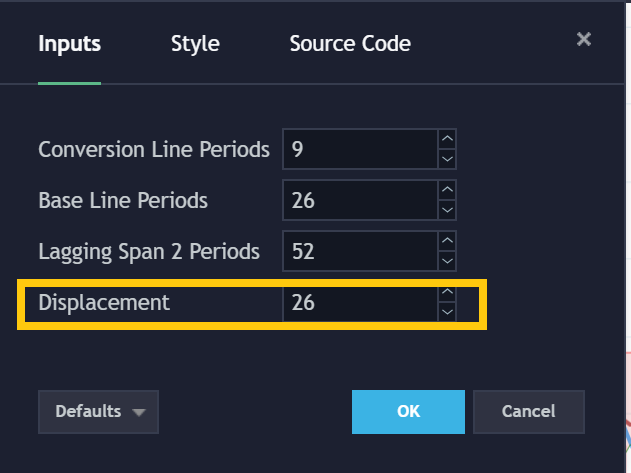
These are the ‘default settings’ that people are up in arms about in the crypto community because “you can’t use those! They don’t apply to crypto!”
In the above picture, you’ll see four different settings which are:
Conversion Line Periods
Base Line Periods
Lagging Span 2 Periods
Displacement
So, let’s go ahead and cover what all of these categories mean, why the default settings are what they are, and why many in the crypto community feel that it is an egregious mistake for anyone to ever use these default settings.
#1 — Conversion and Base Lines
These two names are actually the “English”-version of the Japanese names that were given for these indicators.
Their Japanese-termed counterparts are:
Tenkan-Sen Line = Conversion Line
Kijun-Sen Line = Base Line
As a general rule of thumb, no matter what the settings are on your chart — conversion > base line, or Tenkan-Sen > Kijun-Sen is a bullish cross.
Conversely, the base line > conversion line, or the Kijun-Sen > Tenkan-Sen Line is a bearish cross.
“Cross of What?”
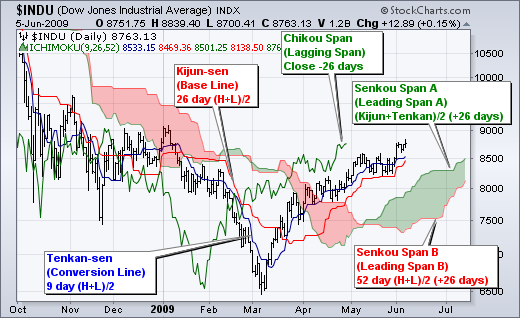
I guess that this would be a good time for you to give a visual of what I’m talking about.
Check this picture out below, I’ll identify both of the lines in question.
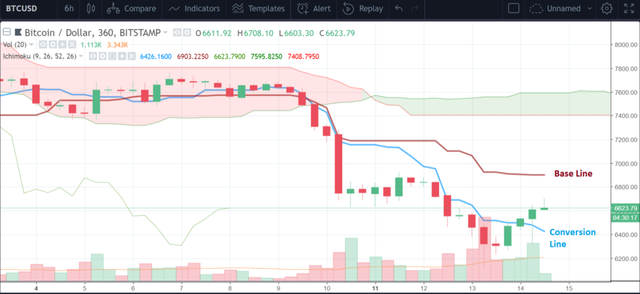
How Do These Lines Work?
Great question, because what I just explained above means absolutely nothing if I don’t explain to you what these lines above mean.
Let’s Start With the Conversion Line / Tenkan-Sen first.
Fortunately, Investopedia has provided us with an awesome definition and explanation of the first one:
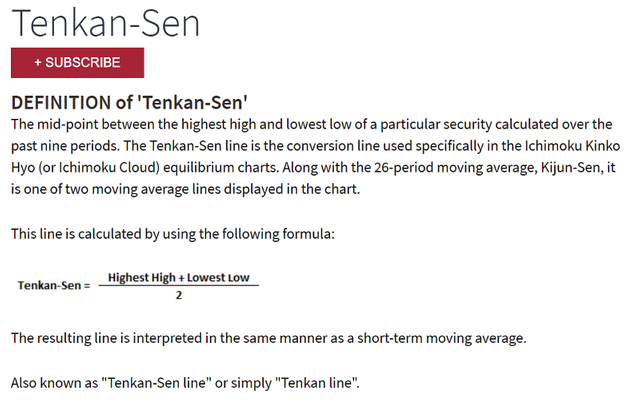
Source: https://www.investopedia.com/terms/t/tenkansen.asp
Here are the Key Takeaways From the Excerpt That I Posted Above:
It takes the highest price and the lowest price, then averages those two out to get a ‘mid-price’. The default settings state that this line will be created by taking that calculation and stretching it out across the previous 9 periods.
This line is a moving average
That means that it is a lagging indicator.
For those that don’t know what it is — there are two types of indicators; Lagging and Leading.
Moving Averages, by default, are always lagging indicators. Lagging indicators, by definition, are called lagging indicators because the information that they give is based on previous information. So, these indicators are primarily used for confirmation signals.
Conversely, leading indicators are used to predict future price action. An example of a leading indicator would be the Relative Strength Index (RSI).
Now, Let’s Go Ahead and Cover the Base/Kijun-Sen Line.
Once again, Investopedia was kind enough to lay out a definition that completely satisfies what we need to know:
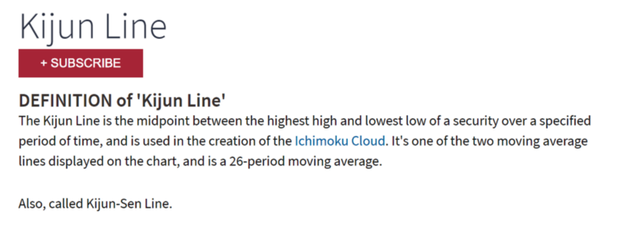
Source: https://www.investopedia.com/terms/k/kijun-line.asp
This definition is a lot more straightforward than the other ones that we were working with previously. Therefore, I won’t go into too much detail.
Just know that, based on the definitions that we received above, these two lines work just like any other MA (in essence).
I wrote an article (that you can use as a primer), which you can read here: https://medium.com/cryptomedication/why-ema-indicators-are-fantastic-support-resistance-points-6e234b484826
That means that these lines can be used as:
-Resistance
-Support
-Confirmation of a Trend
-Buy Signal
-Sell Signal
Resistance: If the price is below either one of these lines, then the line it is below becomes a resistance point (which means that the price will have trouble rising above the line).
Support: If the price is above either one of these lines, then the line that it is above will then become the support. This means that the price may have some sort of pause/halt/reversal before it moves below where this line is at.
Confirmation of Trend: As mentioned above, if the conversion>base line — that’s one of the ways that the Ichimoku is telling us that we’re currently in an uptrend. Conversely, if the base line > conversion line, that’s one of the ways, that the Ichimoku is telling us that the price is in a downtrend. Now, typically, trend isn’t something that can be easily determined with just two moving averages (ideally, you want at least three, just like the Williams’ Alligator). However, there are other ways that the Ichimoku can confirm a trend, which we’ll get into later.
Buy Signal: Conversion Line > Base Line
Sell Signal: Base Line > Conversion Line
That about wraps everything up as far as the Ichimoku Cloud’s Base and Conversion Lines are concerned!
#2 — Displacement
This is the next thing that you saw on that list of ‘default settings’ from that TradingView screenshot that I gave you.
Check that out here:
In Japanese, this is referred to as the ‘Chikou Span’, which is something that’s important for you to remember.
Here’s a little diagram for you to check out to get a better idea of what this is:
This is a part of the Ichimoku that folks generally do not use when drawing an analysis from it for a few reasons (which we’ll cover below), but let’s carve a bit more into our Lagging Span here:
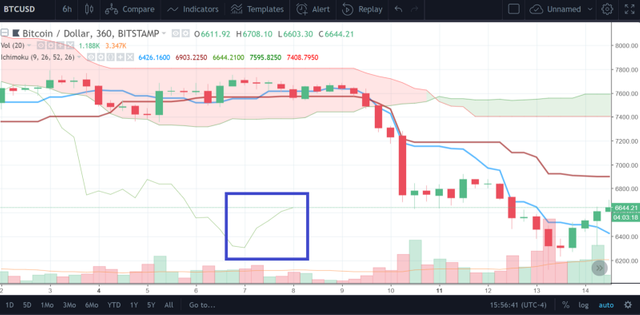
See that weird little squiggly line? That’s the Chikou Span!
Why is it so Far Behind the Price?
Great question.
The reason why it is so far behind the price is because of ‘displacement’.
It basically is like a ‘barometer’ of sorts, to help test whether the Ichimoku has been accurate in attempting to predict and detail the price action of the underlying security (cryptocurrency in this case) that the Ichimoku is applied to.
If that doesn’t make sense, just bear with me.
Let’s Check Out the Official Definition From Investopedia:
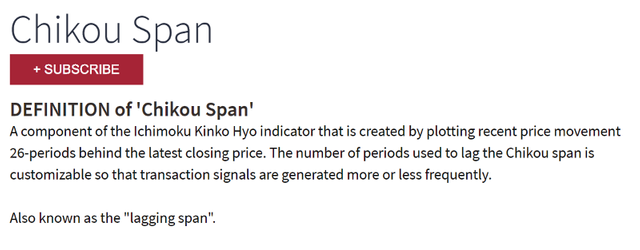
Source: https://www.investopedia.com/terms/c/chikouspan.asp
By Investopedia’s definition, the Chikou Span is typically used for a 26-period lookback.
However, on our default settings, you can see that it is programmed for a 52-period lookback (which is double the time).
In my opinion, in an arena that’s as volatile as cryptocurrency is, it’s hard to imagine that any lagging and displaced indicators will confer tremendous value to the one using it, but it’s worth consideration anyway, right? Right.
It’s worth mentioning that these “flawed” default settings were able to signal off an impending price decline and exhaustion way back in December before the $19–20k blow off top.
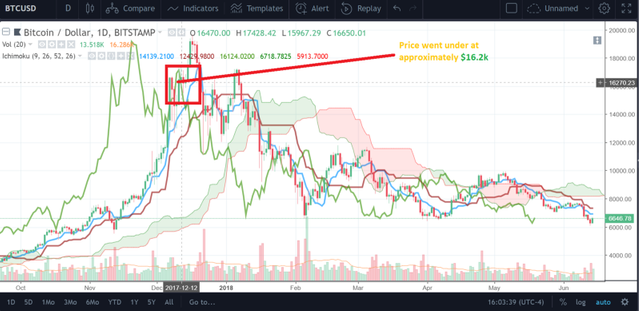
It signaled at around $16k on the daily, as you can see above.
Not too bad for an allegedly deficient default, right?
Now, let’s move on to the final component of the Ichimoku Cloud
#3 — Lead (Senkou) 1 and Lead (Senkou) 2 Span
Below, is a re-posting of the default settings for the Ichimoku from TradingView, once again:
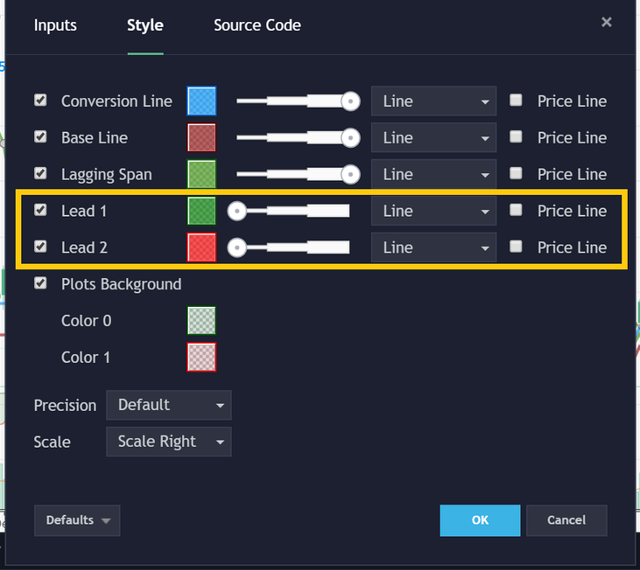
These two lines have captured the hearts and imaginations of traders for years because, together, they both compose the Ichimoku Cloud.
Cloud?
Let’s bring up the graphic that I displayed above in this article, which details the various constituent elements of the Ichimoku.
Here it is:

See those green and red patches in the picture above? They’re created via the distance between the Leading (Senkou) Span 1 and Leading (Senkou) Span 2.
Now, let’s take a look at what these lines are, and how they’re created exactly.
The formula for the Senkou Span A (or 1, whatever) is very simple.
Senkou Span A/1 = Conversion Line + Base Line / 2 ; The amount of periods that it tracks is entirely up to the user.
Senkou Span B/2 = Lagging Span 2 Periods (52-weeks normally) / 2
When the Senkou Span A/1 > Senkou Span B/2 = Green Cloud
When the Senkou Span B/2 > Senkou Span A/1 = Red Cloud
The distance between the two lines forms what is known as the cloud.
There’s a forward-looking displacement on the Ichimoku (as you’ve probably noticed), so there will always be a cloud to the right of the price current price movement, which makes it ‘predictive’ in its own right.
Trading Using the Senkou Spans
There are a few rules that one must adhere to first, but they are not many in number.
#1 — When the cloud is green, that means that the Ichimoku is signaling to you that previous price movement over the periods that it has been slated to track, are indicating that it predicts positive price movement.
#2 — Conversely, when the cloud is red, that means that the Ichimoku is signaling to you that the previous price movement over the periods that it has been slated to track, are indicating that it predicts negative price movement.
#3 — If the price is “in the cloud”, then consider that cloud to be a potential trading range that the price may move within while it’s in there.
#4 — If the price crosses above the cloud, then that is very bullish.
#5 — If the price crosses below the cloud, then that is very bearish.
#6 — If the price is above the cloud, then the cloud will (should — not guaranteed) serve as support.
#7 — If the price is below the cloud, then the cloud will (should — not guaranteed) serve as resistance.
Why are the Default Settings Wrong?
They aren’t.
Saying that the default settings on the Ichimoku are wrong is the equivalent of stating that the toppings you got on your pizza is ‘wrong’.
In fact, the settings that people have tried to apply on the Ichimoku in lieu of the defaults, are much more nonsensical than the defaults could ever be.
A 9 + 26-period look back is a solid amount of time, and at a length that allows for an easier dissection of the price in that regard, which is more immediate-term than looking at an MA-50 indicator.
Similarly, the Chikou Span does well at a 26-period displacement. I’ve never seen any trader seriously refer to it anyway, to be honest. But it looks like a solid trend confirmation, I believe.
Also, the Ichimoku Cloud works fabulously for the settings that it tracks. Especially if it is for Bitcoin on a relatively small-ish timeframe.
The one argument that I could see folks using that may make sense is that the lookback period should be slightly shorter for the Senkou Spans, specifically, because there was such an exponential increase in Bitcoin’s price movement over the last 52 weeks.
However, now that we’re floating at the price of $6k, and 52-weeks ago, the price was hovering around $2.5k-ish, which truly isn’t an astronomical distance from the $6.7k (approximately) price mark that I’m looking at right now, I’d say that those folks claiming that the settings on the Ichimoku are “wrong”, are more than likely full of shit and just have zero fundamental understanding of how this indicator works.
So, don’t worry if someone sends you some dumb shit like that!
Conclusion
Read this article, learn the truth and the math behind the Ichimoku and enjoy trading! And if you alter the settings on your indicator, do it because YOU want to do it.
Thanks!
Great stuff bro. Always learn so much from you. This is amazing ty!
Big, thank you.
@proofofresearch Pretty good.