Bitcoin Price Analysis: Potential Move to $6.5k
Bitcoin Price Analysis: Potential Move to $6.5k
Foreword
So, over the last few days, Bitcoin has exhibited some very interesting price action.
A lot of it reflects manipulation, of course, but it is still fascinating to watch regardless.
Bitcoin Price Analysis
https://www.tradingview.com/x/QZ4tHXYy/
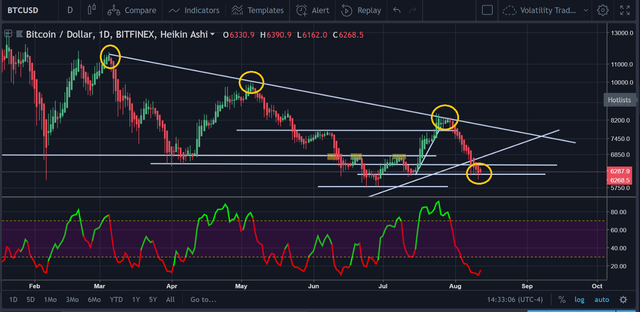
If you’re looking at the 1D chart for Bitcoin, this is what you’ll see (at the time of writing).
The yellow circles above represent the downtrend resistance (from March’s high of $11.5k to now) as well as the resistance line that Bitcoin is bouncing on (somewhat) right now.
https://www.tradingview.com/x/lFYmag1M/
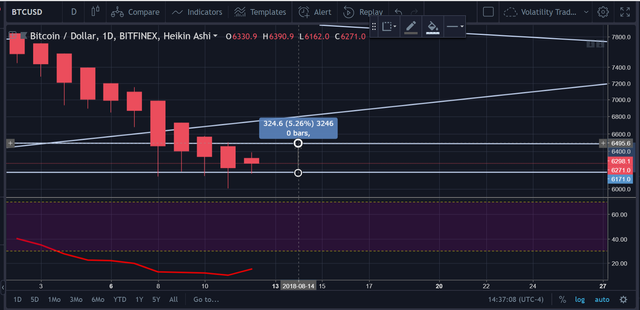
Specifically, this zone is between $6.18k and $6.5k (approx.)
Currently, it appears as though the $6.18k support is holding pretty reliably and that it will be the overhead resistance at $6.5k that will have to contain the price.
It also appears as though the price is slated to eventually reach up to $6.5k at least.
Relative Strength Index
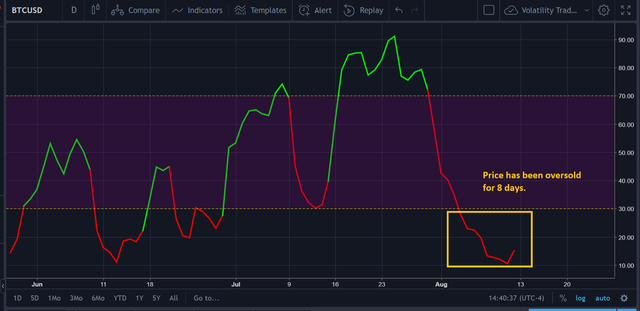
As you probably saw on the charts above, Bitcoin is officially oversold on the daily.
Now, the intuitive assumption here is that the price will bounce up at “any time”.
However, this is not the case in a bear market. See, when an asset is in a bear market, the RSI can remain oversold for as long as it needs to.
On the contrary, when the price is overbought in a bear market, that’s a sign that a drop is more than likely impending soon.
The oversold point is a naturally more frequently occurring phenomena in bear markets = main point+takeaway from the above statements.
https://www.tradingview.com/x/II3jspPv/
The price has been oversold for 8 total days at this point, and it appears that this will easily trickle to day 9 barring some extraordinary price movement. However, once again, this is not out of the ordinary for an asset in the cryptomarket to remain oversold for this much time during a bear market.
Bears and Bulls Fighting One Another For Turf
There is probably no picture that greater epitomizes the struggle between the bears and the bulls as this one:
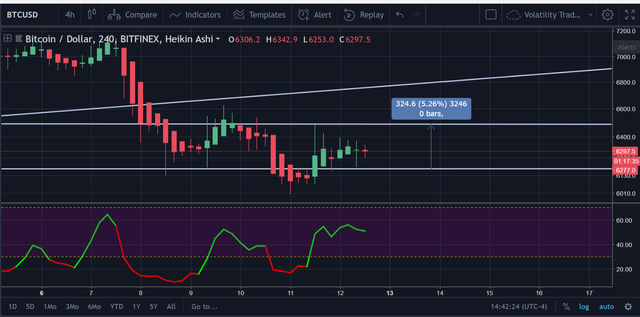
https://www.tradingview.com/x/b6kaFT0u/
- RSI moving sideways.
- Last two candles are clearly doji’s, which are indecisive.
Conclusion
This is anyone’s game. It feels as though there is substantially more upside for those going long than downside, but the market has a mind of its own — so, we’ll have to see!