Forecasting Adventures 9 - Final Research

I have completed the ARIMA analysis on all the publicly available data, of course there might be other data out there, but this is what I could find. I was kind of busy the last days so I could only do this in my spare time, hence the slow progress, it should not take normally this long, but I have other things to take care of as well.
Now this is the last part of the research that I will publish, and I will continue my research but the future findings I will not publish, but rather sell it if anyone wants to buy it. We are talking about predicting the BTC/USD price, so I hope people will be interested in that. So this is the last part that I am publishing for free, I put many hours of work into this, and I give it away for free, and I actually found a few interesting things too, so it's good information as well.
I have completed the ARIMA analysis on the BTC/USD price, in the last episode I have run an ARIMA model on all the variables, cumulative and original.
In this episode I have transformed the data, both the cumulative and the original, and created 2 new datasets, and ran an ARIMA analysis on those too. Surprisingly I found a better model. But first let me explain the theory behind it.
Transformations
Another way to interpret a time-series is like being a signal, like a radio signal. So it has information and noise parts, which can be decomposed, the noise can be filtered out, and you can grab like a signal to noise ratio, just like with a radio signal.
We know that if we decrease the noise the signal decreases too after a certain threshold is hit, but before that the noise can be reduced and the noise won't be affected. This is sort of like big price spikes that only last 1 datapoint, usually an error in the order book of the exchange, it's meaningless data and it distorts the price, so removing that, is like removing the clipping noise from an audio data.
So quantitative analysts know that you can filter or transform that data to either enhance the SNR or shape it in a way you want for your analysis.
You can do anything with your data, there are only 2 rules:
- You can't leap into the future, obviously, so the function can only run up to the present data you are analyzing.
- The transformation function must be injective, meaning that 1 output must only have 1 input, or all inputs could have max 1 matching output bijection, but one output can only have maximum 1 input.
So there are plenty of ways to transform the data from linear transformations to non-linear transformations.
LN Transformation
So we already know that the best model is (0,1,1) which suggests a non-linear, close to exponential function. The differentiation in the d element is not sufficient in the ARIMA model to address that.
You can test this on a simple exponential data like 2,4,8,16,32,64,128, the ARIMA model simply can't predict the next element, no matter how hard you differentiate, it will always miss it, despite being simple for a human to guess the next element.
This is because the differentiation is linear, and we can't deal with exponential data in any way in an ARIMA model.
So I have transformed the data, both the cumulative and the original with the LN(x) function, just simply taking the natural log value of every point of every variable. We know that the LN function is injective, so our transformation is legitimate, however the LN value can't map the 0 and negative values, those I just corrected out.
Filtering the data through an LN function already removes the exponential element and makes it linear, so it's kind of a non-linear differencing tool. It can be any base logarithm, since all logarithms are like that, but I like the natural log.
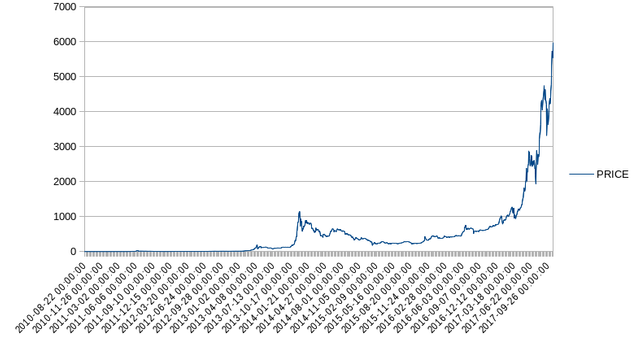
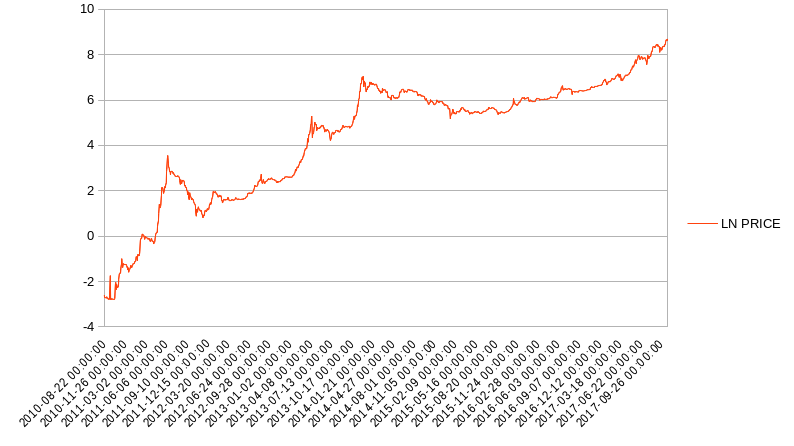
As you can see the transformation is obvious, and this effect is applied to all other variables. The values don't matter, only the relationship between the values which is preserved through the injective nature of the function, but transformed in a way to remove the exponential element. It's like, again using the radio example, morphing the sound of your voice into a high pitch one, that also compresses the audio, but in an injective way, so when you transform it back it will be the original voice. The LN function does the same thing, it compresses the price and transforms the exponential into linear relationship, but after we transform it back we get the same values. And the only reason we do this is because the ARIMA model can't handle exponential relationship, so we must make it linear.
Using the example above, the ARIMA can't predict the 2,4,8,16,32,64,128,256 series, but it can easily predict the 0.693147180559945, 1.38629436111989, 2.07944154167984, 2.77258872223978, 3.46573590279973, 4.15888308335967, 4.85203026391962, 5.54517744447956 series, which is the same series transformed.
Methodology
So the methodology is simple, I have created 2 new sets of data transformed through an LN function, to not confuse it with the other data, it's put in 2 new files, one for the original one for the cumulative.
Then I have redone the ARIMA analysis on this data again, for all variables. Calculated the model, then did the backtesting.
Then transformed back the backtested fitted values into the original ones with the EXP(x) function, which transforms back the LN into it's original form. And then just calculate the LN error, comparing these values to the actual price.
Surprisingly I found a much better model!
Best Model
The best model so far, radically better than anything before it, is on the cumulative data set, transformed by LN, with the transaction-fees-usd.csv variable.
So that is ARIMAX(0,1,1){ LN(transaction-fees-usd.csv)_1 }, it’s still (0,1,1) so that model is rock solid, I will also write it as _1 since we obviously shift back the variable and the theta parameter by 1 lag. So that is the LAG(1) value of both theta and the USD transaction fee variable.
| Variable | Coefficient | 95% Confidence Interval |
|---|---|---|
| Constant | 0.000975838 | -0.00524754 <> 0.00719922 |
| Theta_1 | −0.113114 | -0.176310 <> -0.0499184 |
| transaction-fees-usd.csv_1 | 0.421431 | 0.296693 <> 0.546169 |
So that is the best model that I have found so far, and the LN error of it is: 0.031060897872341 with a Theil’s U value of 0.987518462132983. It is predictive, so in theory it should be profitable.
Now this is for this dataset only, if you want to calculate this model ( the ARIMAX(0,1,1){ LN(transaction-fees-usd.csv)_1 } ), on the most recent data then the parameters (the table above) have to be recalculated with a statistical software that calculates ARIMAX models, obviously.
All the datasets can be downloaded here:
Compare that to the previous model 0.0315442608 and I don’t know it’s Theil U value but it was worse. Compare that to the first model with an error of 0.03175527080004521 from where we started with the linear forecasting tool.
There are LN values so translating them back that would mean that the current model is 0.06946% better than what we started with.
Of course that doesn’t look like a big step ahead but you have to put that into perspective, even a small advantage could be profitable and the Theil’U value indicates that this forecast method should be predictive and thus possibly profitable.
Of course if the error would be 0, that would be a perfect one, but that is impossible, but even a small edge can be useful.
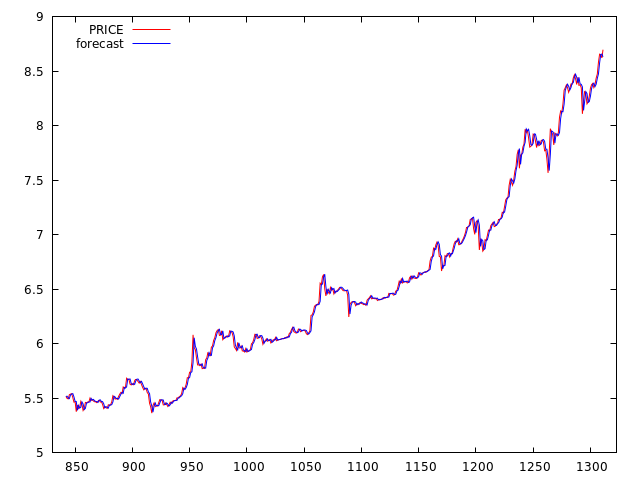
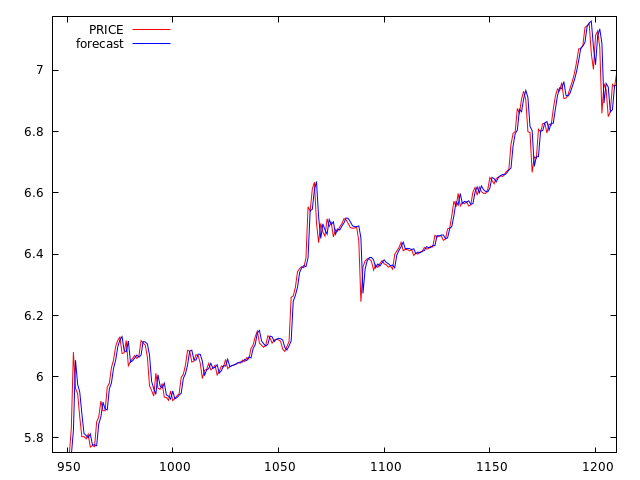
This is how the model fits to the price, as you can see it mostly uses the previous value for the current value, but not always. In some cases it nails the next value perfectly, especially after the price has been going up with the same rate multiple times. So it either gives the previous value or it almost nails the price.
In a dynamic forecast without update, it can also forecast the trend pretty accurately:
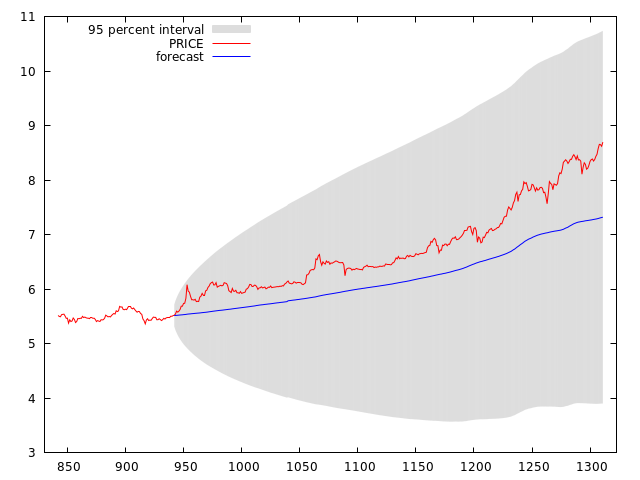
So this is it, this is the best model so far that I know of, you can play with it and see for yourself.
Conclusion
So I have finished this part of my research, but this is only the tip of the iceberg. There are many more things that can be researched: Kalman Filters, HP Filters, Fourier Analysis, and many other stuff, the list is endless. I have many ideas.
The best model so far published in this article is free, but since I barely make any money yet this research takes a lot of my time, thus I will not publish my future research here.
Instead I may publish some of my forecasts with future models, or I may sell future models for Bitcoins or Steem, but I will not publish them.
So if anyone is interested in my work, you can contact me, and if I find anything better, I can sell it to you.
Disclaimer: The information provided on this page or blog post might be incorrect, inaccurate or incomplete. I am not responsible if you lose money or other valuables using the information on this page or blog post! This page or blog post is not an investment advice, just my opinion and analysis for educational or entertainment purposes.
Sources:
https://pixabay.com
