Fractals, Death Cross and Bitcoin price prediction for 2018
Disclaimer: This is not to be treated as financial advice. Although I'm long term bullish on Bitcoin personally, I've not invested everything i own into Bitcoin. Always take a crypto advice from anyone, including me, with a truckload of salt. I know I do.
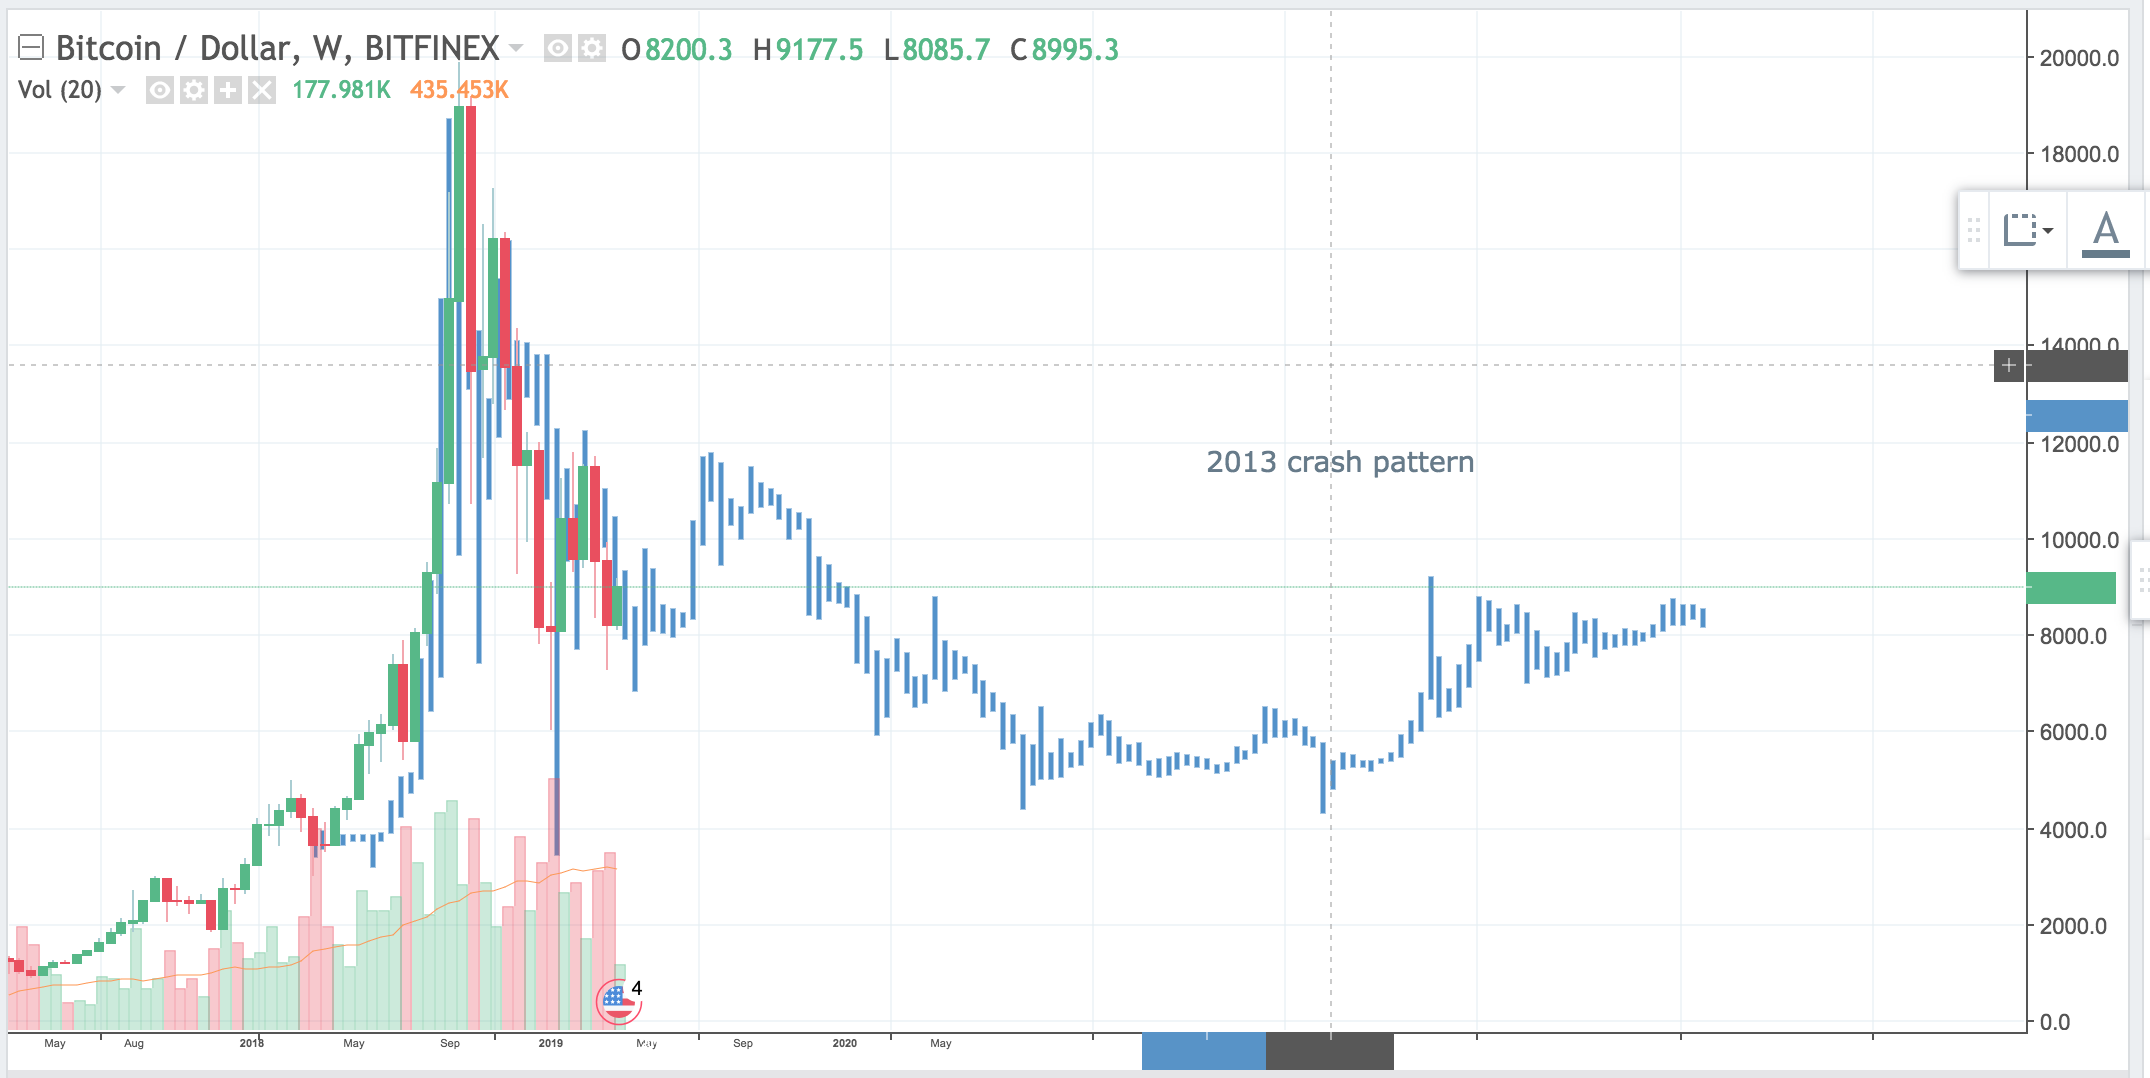
Over the last few days I've heard about the infamous Death Cross of Bitcoin in 2013-14 that followed by a year long bear market. so I was wondering whether there was a way to chart it out. I did, and I was stunned by the outcome.
It goes without saying that it's never 100% perfect but the current Bitcoin pricing seems pretty damn close to what it was doing in the year 2013. It of course follows that the time was different back then and certainly more people are receptive of Bitcoin in 2018 than they were in 2013. So I believe that any crashes and the peaks wouldn't last for too long this time around.
So based on that, here's what I've found so far.
Low Price
As far as the low price goes I think the pattern suggests we're going to reach the low price of about 6000 to 5000 in the short term. Now if you go by the 2013-2014 crash the bear market was a year long AFTER the death cross which we haven't seen yet in 2018. This is the second death cross ever in Bitcoin and no one can say if the death cross event happens, how long we would remain bearish. It may very well happen that we'd reach a golden cross soon.
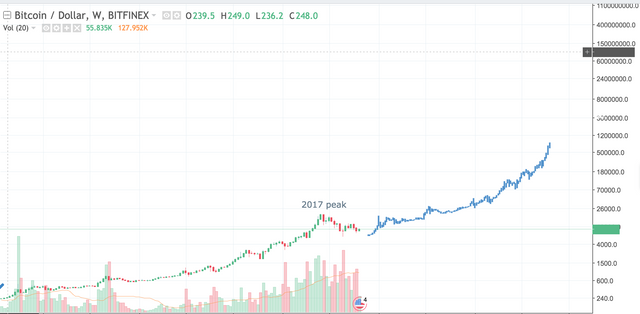
High Price
I had to use the log scale for this. As for the long term pricing on the high side, the pattern suggests that the next high peak would be higher than 100k! It may not happen tomorrow, or next year but based on the pattern it does look like we're headed there.
Now I understand why people were predicting the lows and highs back in Nov 2017..