News: Bitcoin, Ethereum, Bitcoin Cash, Ripple, IOTA, Litecoin, NEM, Cardano: Price Analysis, Jan. 12. ( love steemit love all )

The South Korean government has confirmed that it has no plans to ban cryptocurrency trading in the short-term. This is a major relief to the markets, which were reeling under selling pressure.
Warren Buffet’s warning that the cryptocurrencies will have a “bad ending” also did not have any noticeable effect on the prices.
During the recent decline, instead of being perturbed, many traders saw this as a buying opportunity and rushed to open new accounts. The cryptocurrency exchange Binance saw a whopping addition of 240,000 users in just an hour on Jan. 10.
However, unlike the previous occasions, the pullback from the lows has been muted. Is this a sign of waning momentum? Let’s find out.
BTC/USD
Bitcoin broke below the 50-day SMA on Jan. 11 and since then, it has been struggling to climb above it. It has managed to hold on to the critical support level between the trendline of the symmetrical triangle and the neckline of the head and shoulders pattern.
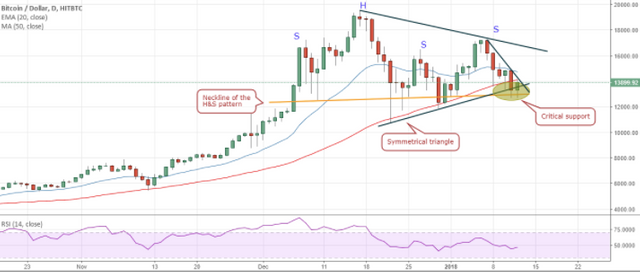
If Bitcoin fails to rally within the next two days, chances are that it will turn down and break below $12,500, sinking it to $8,000 levels.
On the other hand, if the cryptocurrency clings on to the support and moves above the 20-day EMA, it will indicate a short-term bottom.
Very aggressive traders can buy on a breakout above $14,500 and keep a stop loss of $12,500. The target objective of this trade is $16,500. This is a very risky trade, hence, should be attempted with only 25 percent of the usual position size.
Risk-averse traders should wait for a reliable setup to form as there is no clear trend on the BTC/USD pair as long as it trades inside the triangle. It’s better to wait for a breakout or breakdown from the triangle before initiating any positions.
ETH/USD
Ethereum has been comparatively strong during the South Korean ban episode. This shows that its owners are not in a hurry to sell their holdings.
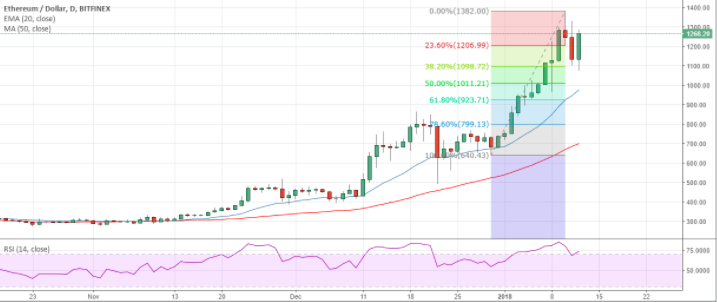
The buyers jumped in at the 38.2 percent Fibonacci retracement levels of the latest rally from $640.43 to $1,382. The uptrend remains intact and the bulls are likely to make another attempt to break out of the recent highs at $1,382.
If the price breaks out of the overhead resistance zone of $1,382 to $1,434, it will signal the start of the next leg of the up move, which can carry the ETH/USD pair towards its target objective of $1,814.67.
On the downside, support exists at the 20-day EMA and at $965.18, which is the intraday low on Jan. 8.
However, as we expect a strong resistance between $1,382 and $1,434, we are not recommending any fresh long positions in it.
BCH/USD
Bitcoin Cash broke out of the range on Jan. 10, however, contrary to our expectation, it could not rally to $3,249. It faced strong resistance at $2,950 and turned down from there.
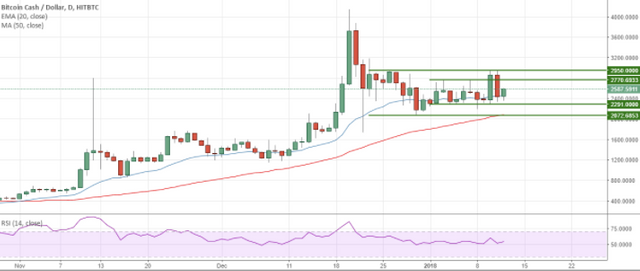
It continues to be range bound but in a larger range. On the upside, $2,950 is the critical resistance and on the downside, $2,291 continues to be a strong support. If this support breaks, it has another support at the $2,072 level.
Traders should wait for a breakout above $2950 to initiate long positions. The breakout is likely to carry the BCH/USD pair towards the highs.
On the other hand, a breakdown below $2,072 can result in a decline to $1,733 and thereafter to $1,200.
XRP/USD
For the past three days, Ripple has been attempting to hold the uptrend line. The bulls continue to buy the dips close to the $1.5 levels.
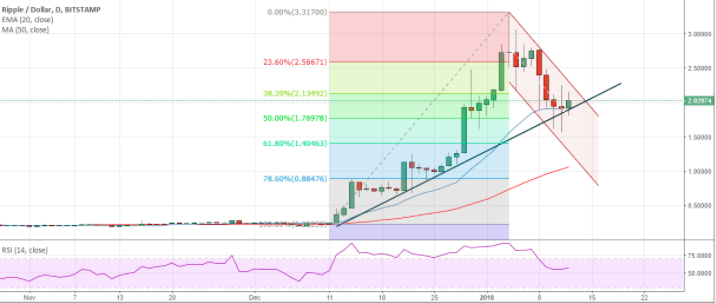
The cryptocurrency is currently correcting inside a descending channel. If the bulls succeed in breaking out of the resistance line of the channel, a move to $2.85 is likely.
Strong support exists between $1.76978 and $1.40463, which are 50 percent and 61.8 percent Fibonacci retracement levels of the recent rally from $0.22255 to $3.317.
But we don’t find any reliable buy setups on the XRP/USD pair. Hence, we are not recommending any trade on it.
IOTA/USD
IOTA has continued its range-bound trading between $3.032 and $4.34. Yesterday, Jan. 11, the bulls again defended the lower end of the range.
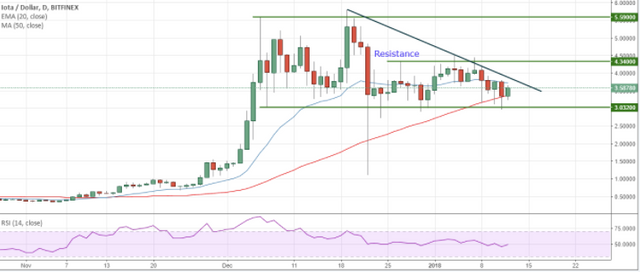
We expect the range to hold. Hence, traders can buy on weakness towards $3.1 and keep a stop loss of $2.7.
The IOTA/USD pair should attempt to move towards $4.34 once it breaks out of the downtrend line. A move above $4.34 is likely to propel it towards the upper end of the range at $5.59.
Our bullish view will be invalidated if price breaks down and sustains below $3.032.
LTC/USD
Litecoin is still stuck inside the symmetrical triangle. Yesterday, Jan.11, the bears failed to break down of the triangle.
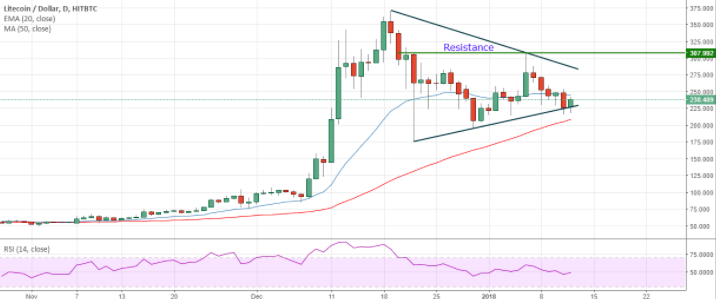
The bulls will now try to push prices towards the resistance line of the triangle at $280. The move will gain momentum above $254. The support is way lower at $215.
At the moment the risk to reward ratio is not attractive for trades.
The LTC/USD pair will become bearish if price breaks down and sustains below the 50-day SMA.
XEM/USD
As forecast in our previous analysis, the decline to the trendline support prompted buying. NEM is currently in a pullback. Should we trade this?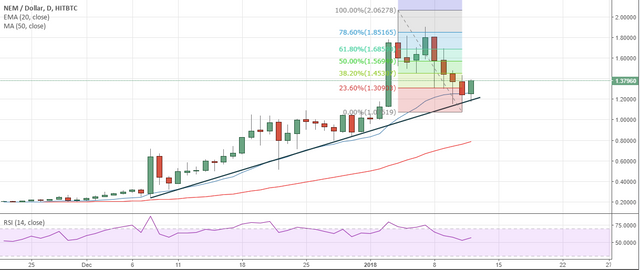
The traders bought the dip below the trendline support yesterday, Jan. 11. We now expect the XEM/USD pair to rally to $1.56949 and $1.68590, which are 50 percent and 61.8 percent Fibonacci retracement levels of the recent fall from $2.06278 to $1.07619.
The aggressive traders can buy at the current levels of $1.38 and keep a stop loss at $1.06, below yesterday’s lows. Though the initial risk to reward ratio is not attractive, we believe that buying near the strong support of the trendline is a good strategy.
ADA/BTC
Buyers bought the dip below the trendline on Jan. 11. We had forecast a pullback from the trendline in our previous analysis but advised waiting for a confirmation of a bottom before buying. So, can the traders buy now?
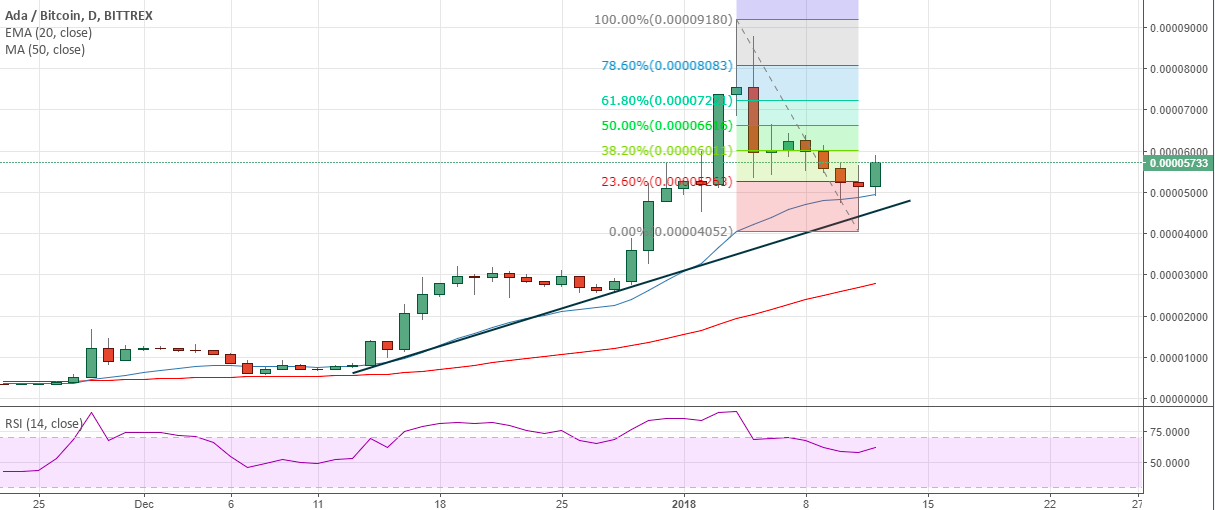
If the pullback sustains above the 0.000057 levels, we expect the move to extend to $0.00006616 and $0.00007221, which are 50 percent and 61.8 percent Fibonacci retracement levels of the recent fall.
Traders can buy the ADA/BTC pair at the current levels and keep a stop loss at 0.00004. Here too, we are recommending a trade without an attractive risk to reward ratio because we are buying close to the strong support of the trendline from where the price can surprise on the upside.
by:cointelegraph.com
VOTE and follow and like me:
Thank you!
Follow me on Steemit: https://steemit.com/@phutv23

Follow me on Twitter : https://twitter.com/JmyTran

Follow me on https://d.tube :
your info is very insightful and appreciated!
Thank you!
Follow me on Steemit: https://steemit.com/@phutv23

Follow me on Twitter : https://twitter.com/JmyTran

Follow me on https://d.tube :