Cryptocurrencies - Bitcoin 2018 Outlook: Low $5.000 and High $90.000 (End of Year)
Bitcoin is the real Silver Surfer!
During October 2017 I noticed for the first time, that Bitcoin resembles the pattern of Gold during the 1998-2012 period.
In this post, I will share this first chart and how this idea (Gold/Silver parabolic pattern vs Bitcoin) evolved to my outlook for Bitcoin 2018: Low $5.000 and High end of year $90.000.
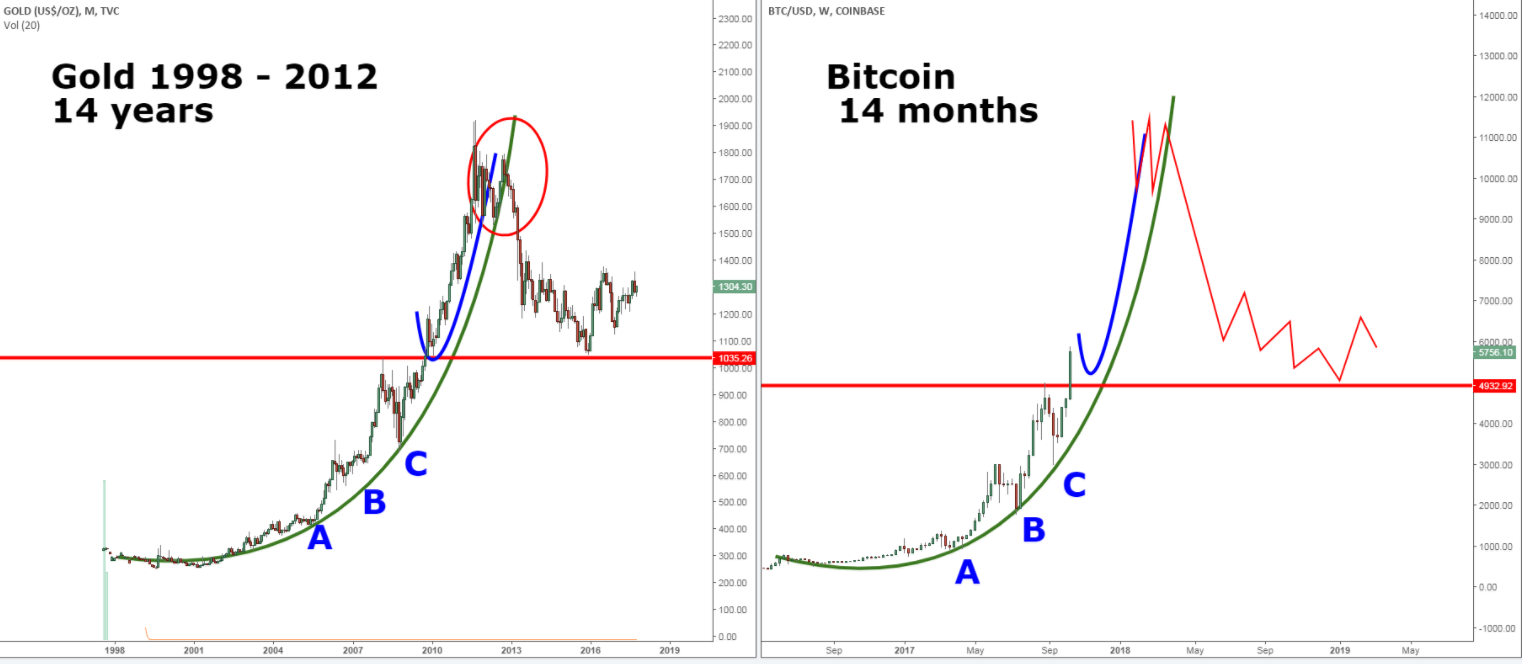
Let's start with the 1st chart that I created, when I first noticed the comparison of the parabolic patterns (Oct 15, 2017). The left side is the monthly chart of Gold and the right side is Bitcoin, weekly time frame.
The original idea shows a simple ABC and a parabolic/vertical move up, to top out into December 2017 and start the drop into 2018. Although the timing seemed quite alright, price moved a lot higher than I originally anticipated.
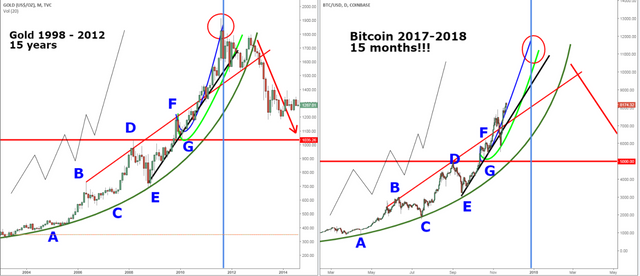
Fast forward to November 21, when I gave more color to the two patterns. Still, the timing was quite alright, but as often the case with parabolic/vertical moves, price exceeds the rational and my target of $12k was way too conservative.
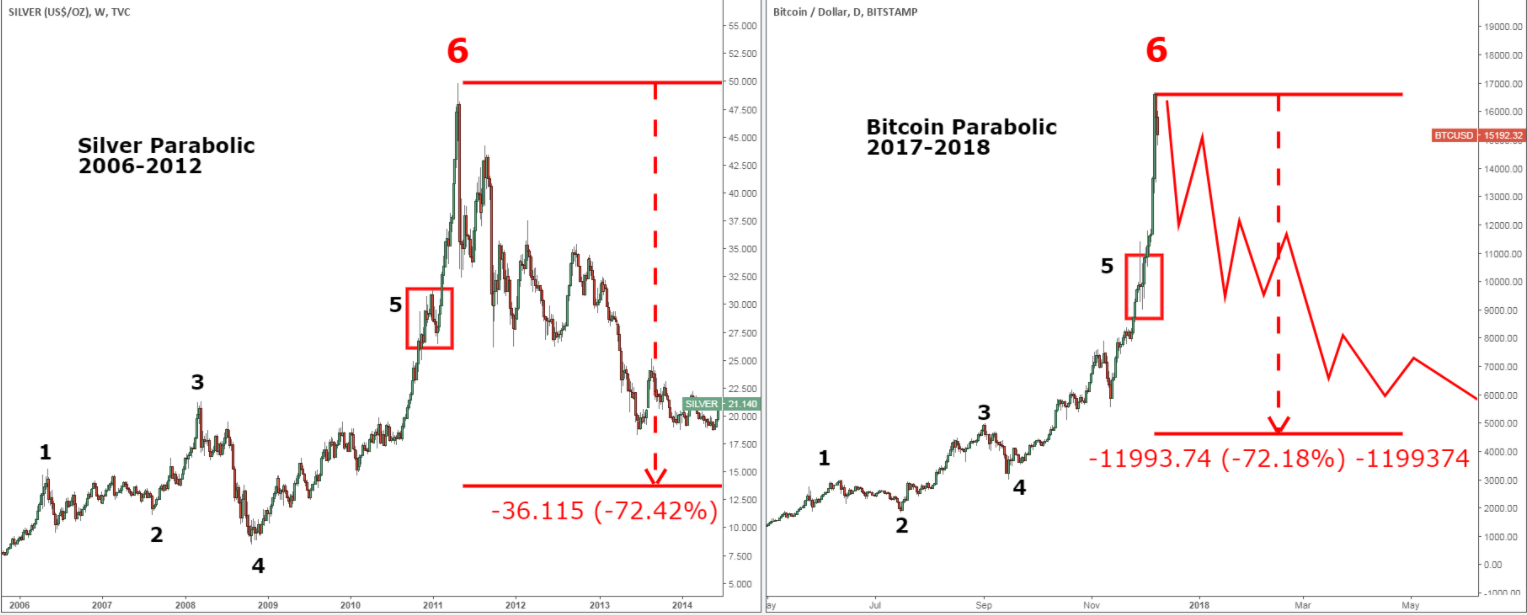
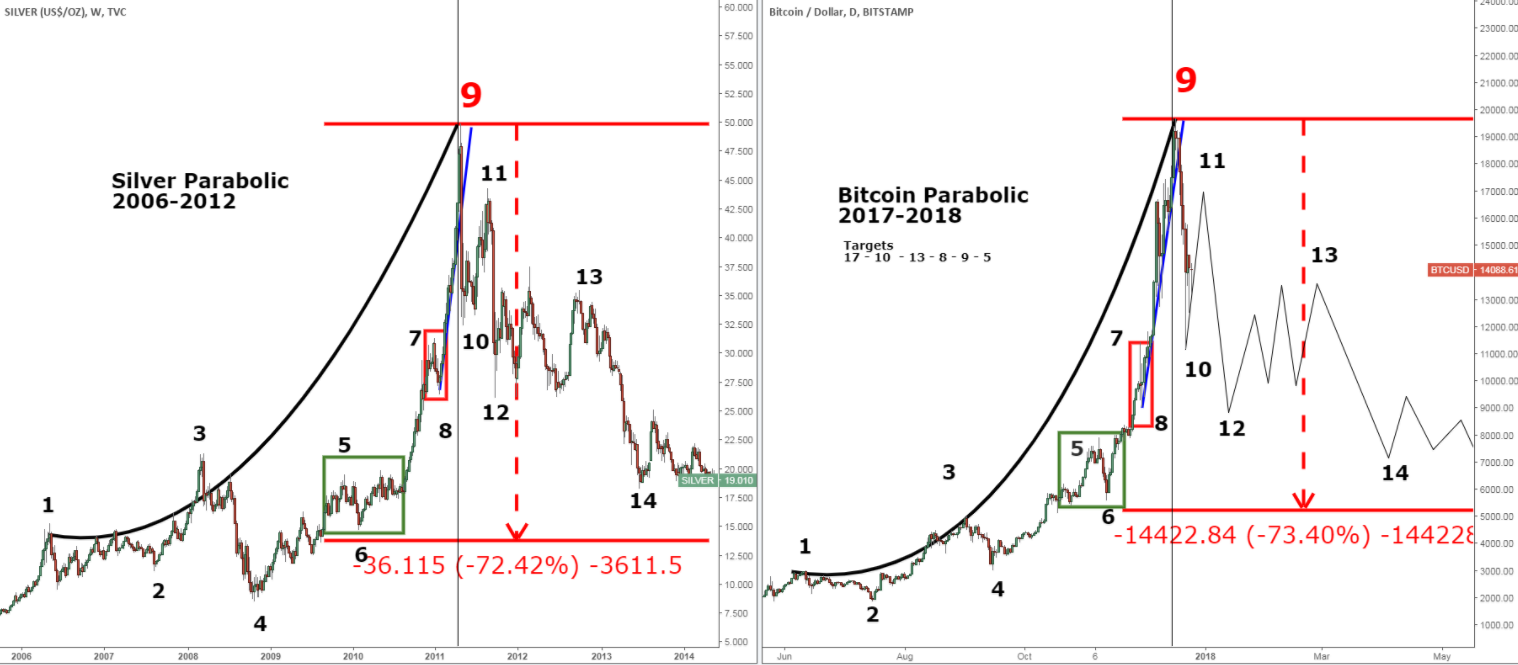
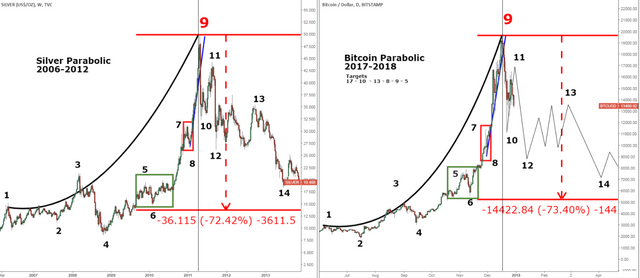
December 9, 2017, I noticed that the Silver pattern of the same period (1998-2012) could be a road map for Bitcoin into Q4 2017 and 2018.
The left side shows Silver, a 1-2-3-4-5-6 pattern. Again, I was a bit too eager for price to drop as you know it expanded above nr. 6 and kissed the $20.000.
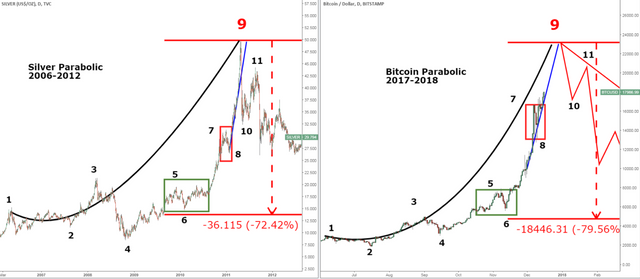
December 16, 2017, I made this chart, changing from a 1-6 to a 1-9 pattern AND I changed the Silver chart to a DAILY time frame instead of weekly. Reason: it fits the pattern/numbers way better. The numbers are only used to indicate where we are compared to Silver.
Nr. 9 should be the blow off top, a vertical move up. As often the case, when you change your mind a bit about the upside target, it's is ready to reverse trend to the downside. And so it did.
Fast forward to December 25, 2017, and Bitcoin declined from 20k to 11k, nr. 10, a 45% drop. After nr. 10, a dead cat bounce into 11 was expected.
And so it did. Nr. 11 reached the $16.500 area, a lower high and looks like a dead cat bounce.
So based on the evolution of these charts/trading ideas/patterns, I formed this outlook for 2018:
Daily Chart: Silver vs Bitcoin: nr. 12 and nr. 14 --> a low < $10.000 and once that low if formed, we should expect new highs into end of 2018 (see monthly chart below).
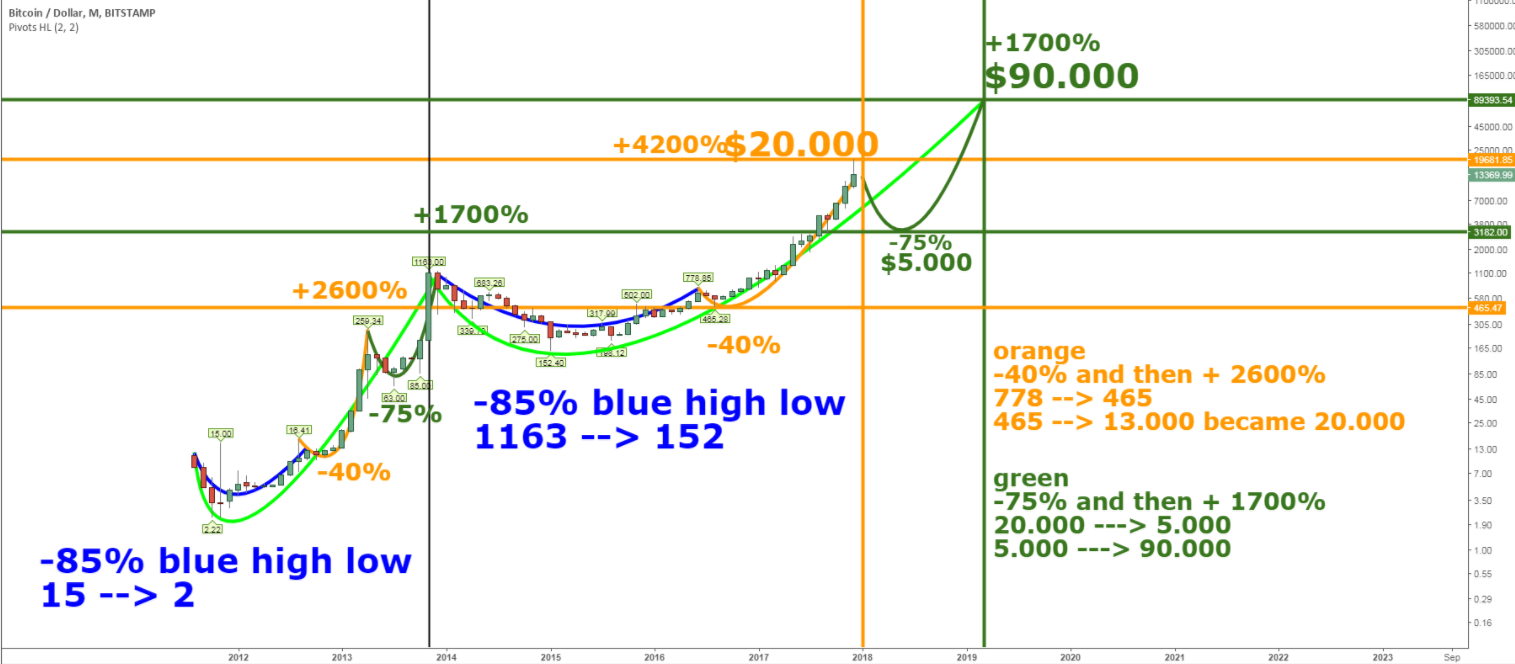
Bitcoin Monthly Pattern (log chart)
Current stage: a drop of 75% after the orange high. Once the green low is formed, then we could go up 1700% into 2019. Target $90.000+
I was overweight cryptos into Q4 2017 (20% of assets, a bit too much) but decreased that exposure during Nov/Dec to 5% of assets and now I will wait for new opportunities to add to my long term crypto portfolio.
Feel free to ask questions or share your own view. Keep in mind, that patterns only work till they don't. So it's (unfortunately) never a guarantee.
I do see similar patterns for the US stock markets (parabolic), that warn for a drop into 2018. I will share that view after the New Year's Eve!
But first, enjoy yours!
Happy NewYear!
Great analysis, lets see what 2018 will bring. its going to be a roller coaster.
Thanks! Great analysis doesn't make great profit yet, but I do think there will be nice opportunities to go long again, summer 2018? We'll see :)
Happy Newyear!
incredible analysis mate!! I will follow you prediction!
Lots of altcoins will surprise (and in a great way). Here's to a profitable 2018 for everyone!
#bitcoin
how to get it for free, can you explain
Man!! Have you seen your own prediction after these 19 days? Wow..