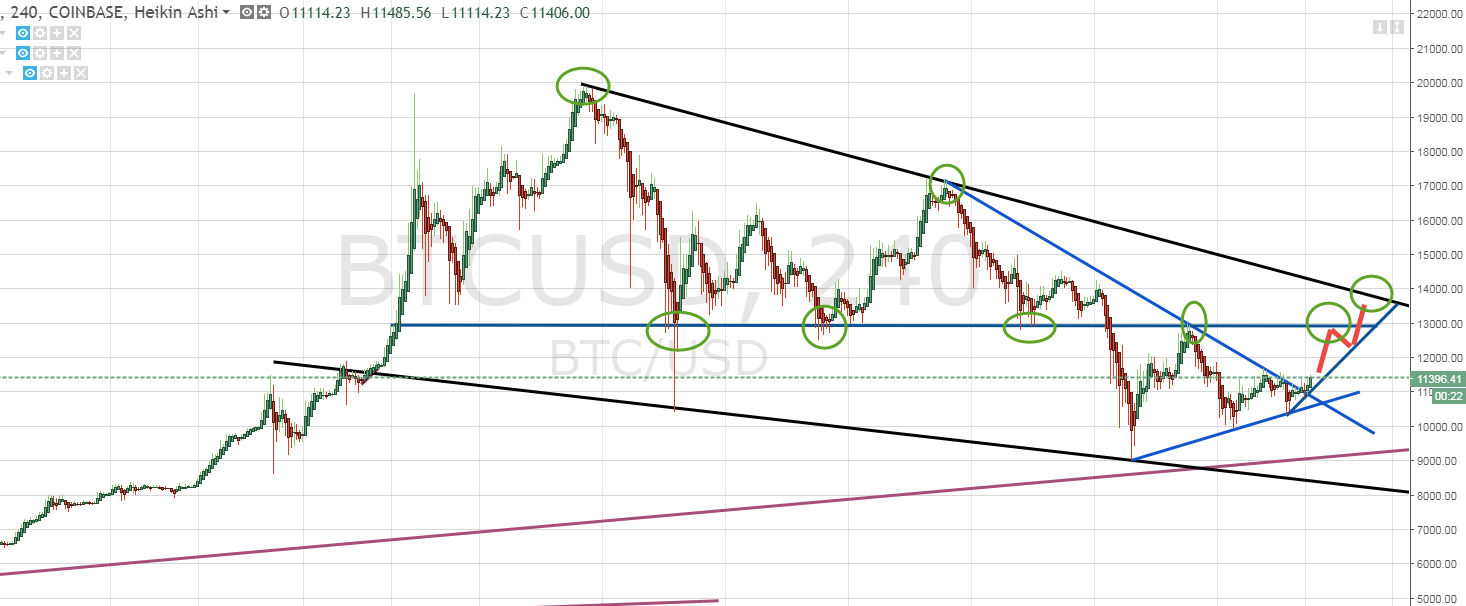
BTCUSD Price Chart Analysis 01/27/2017
Hello Again,
I made a quick update because price breached the short term lower moving TL around 11000 level and BTC is turning bullish in short term.
As can be seen in the chart. Price can move up to the 13000 level and then if 13000 level is breached 14000 is the next major resistance.
Once 14000 is breached then I would consider that we could see mid 20,000 within few months. If 14000 level holds then there is another possiblity of BTC to move down back to 8000-1000 level depending on where the bottom down moving TL (black bottom line coming down) is at that time.
Hope this analysis is helpful.
NOTE: If anyone wants me analyze any specific forex, cryptocurrency or stock chart please let me know and will do my best to analyze it.
This is not a trading advise and just my opinion, please trade at your risk and do your research.
Below is the chart.
Regards,

Logo