Bitcoin: A Chart Analysis From 2010 Until Now
I Finally managed to get the historical data of Bitcoin from the times it was worth only 5 cents, until today!
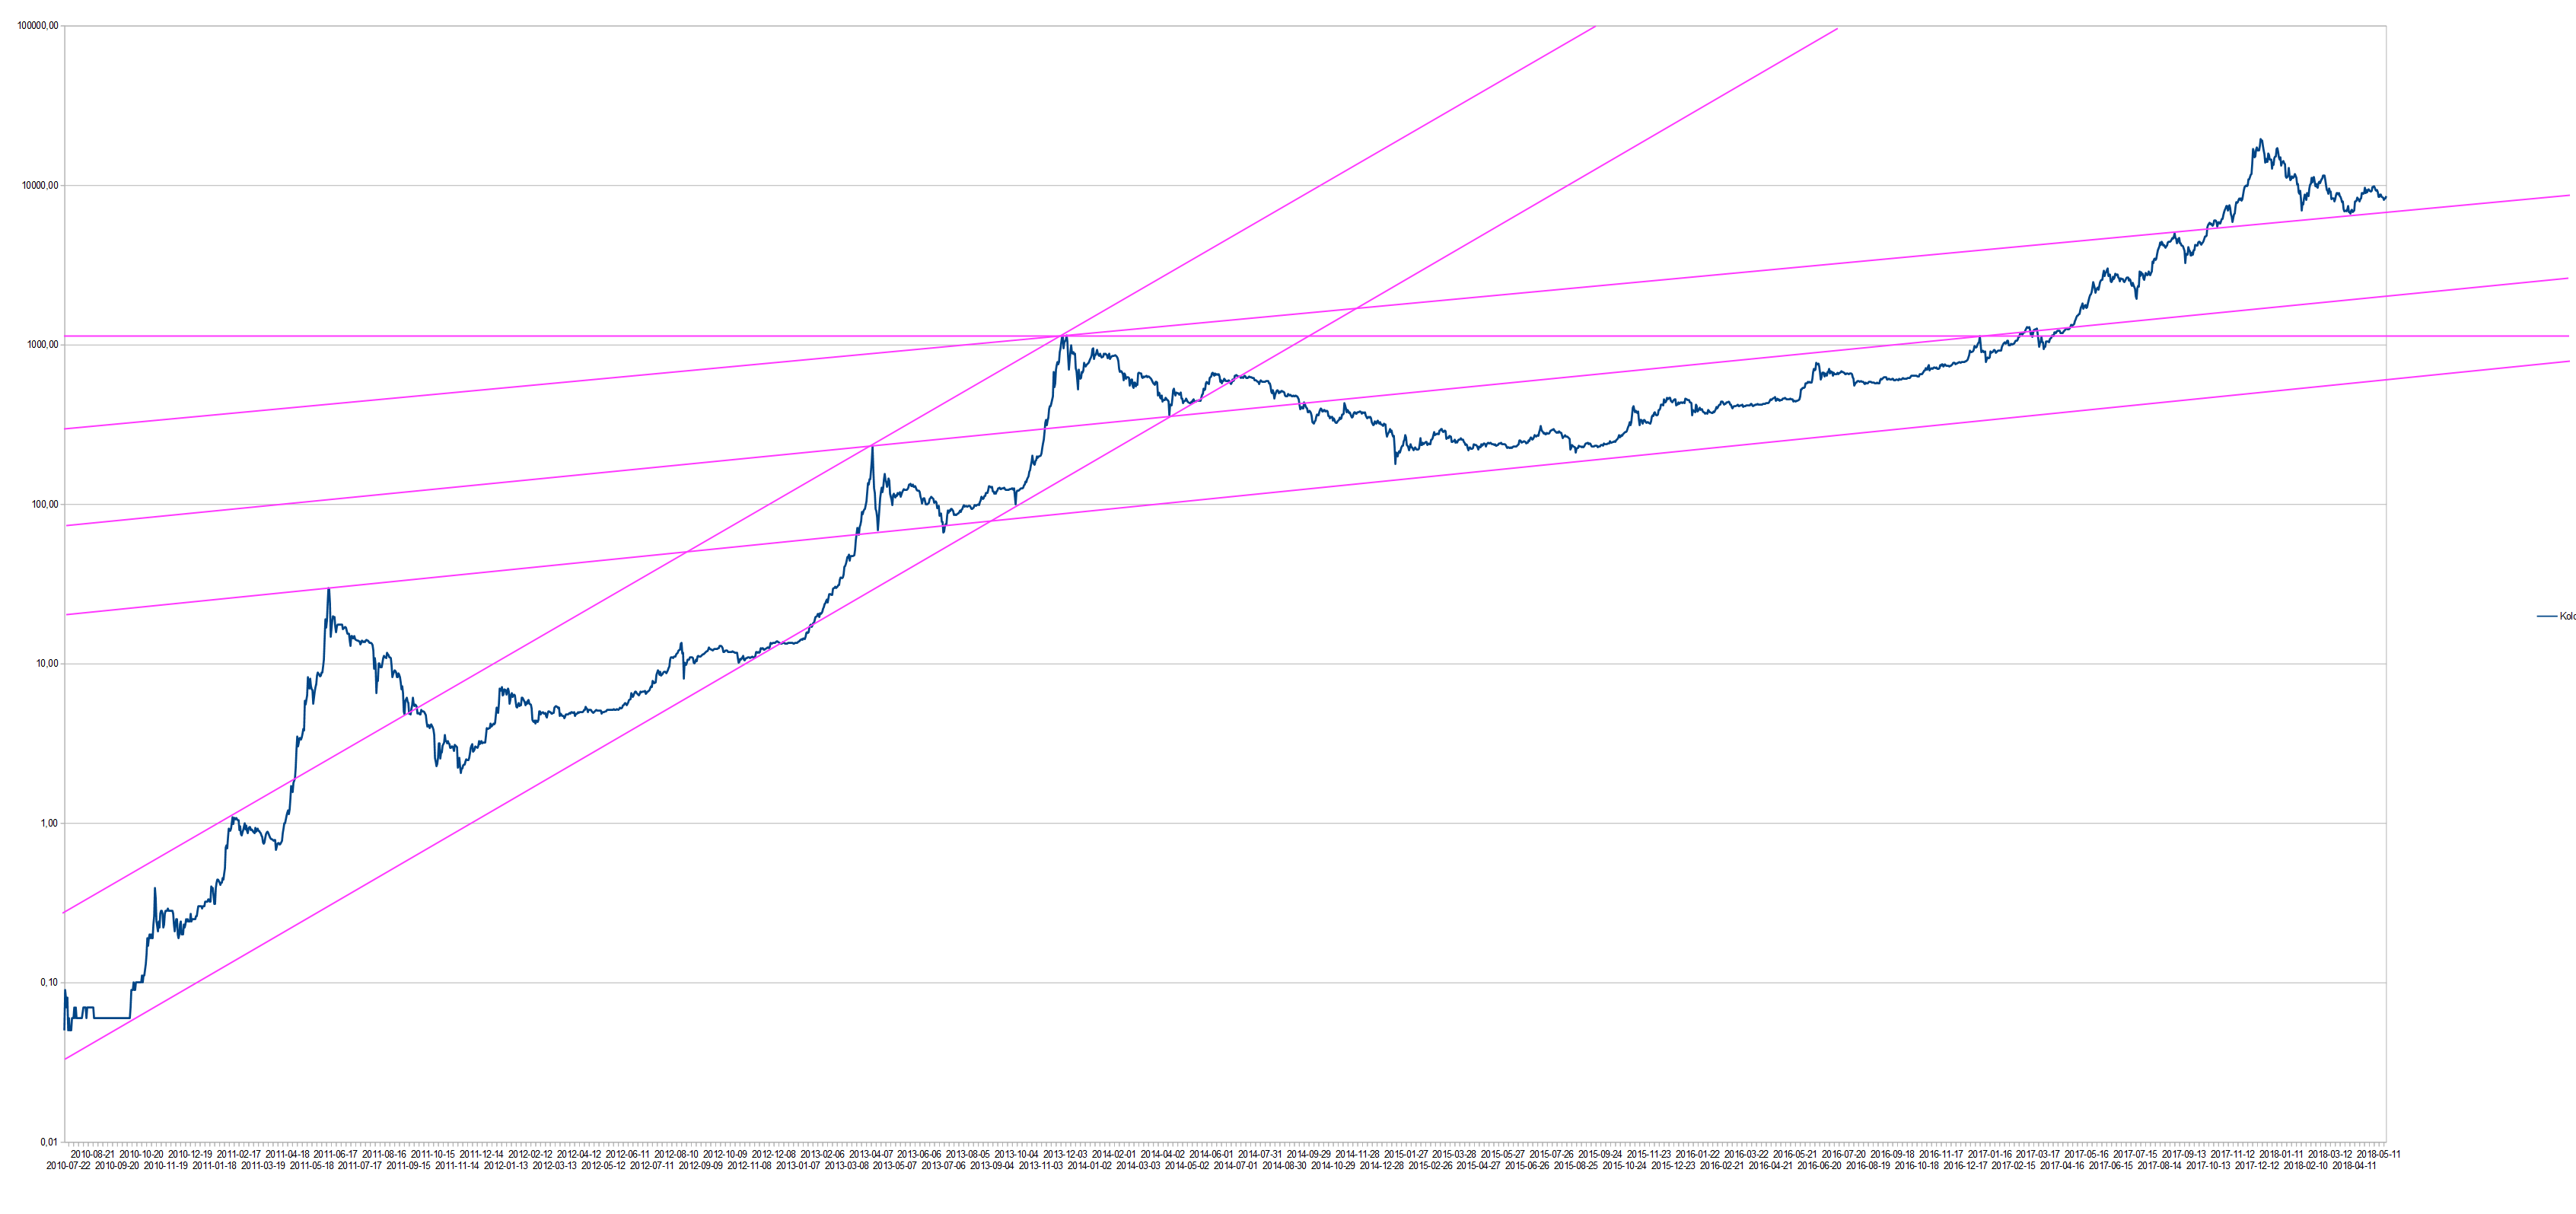
I also found a way to display the data in logarithmic format.
These are the long term trendlines that emerged
Bitcoin traders like having Fun. So it appears to be that Bitcoin reached its value of 10 cents on 2010.10.10 :-) (first green vertical)
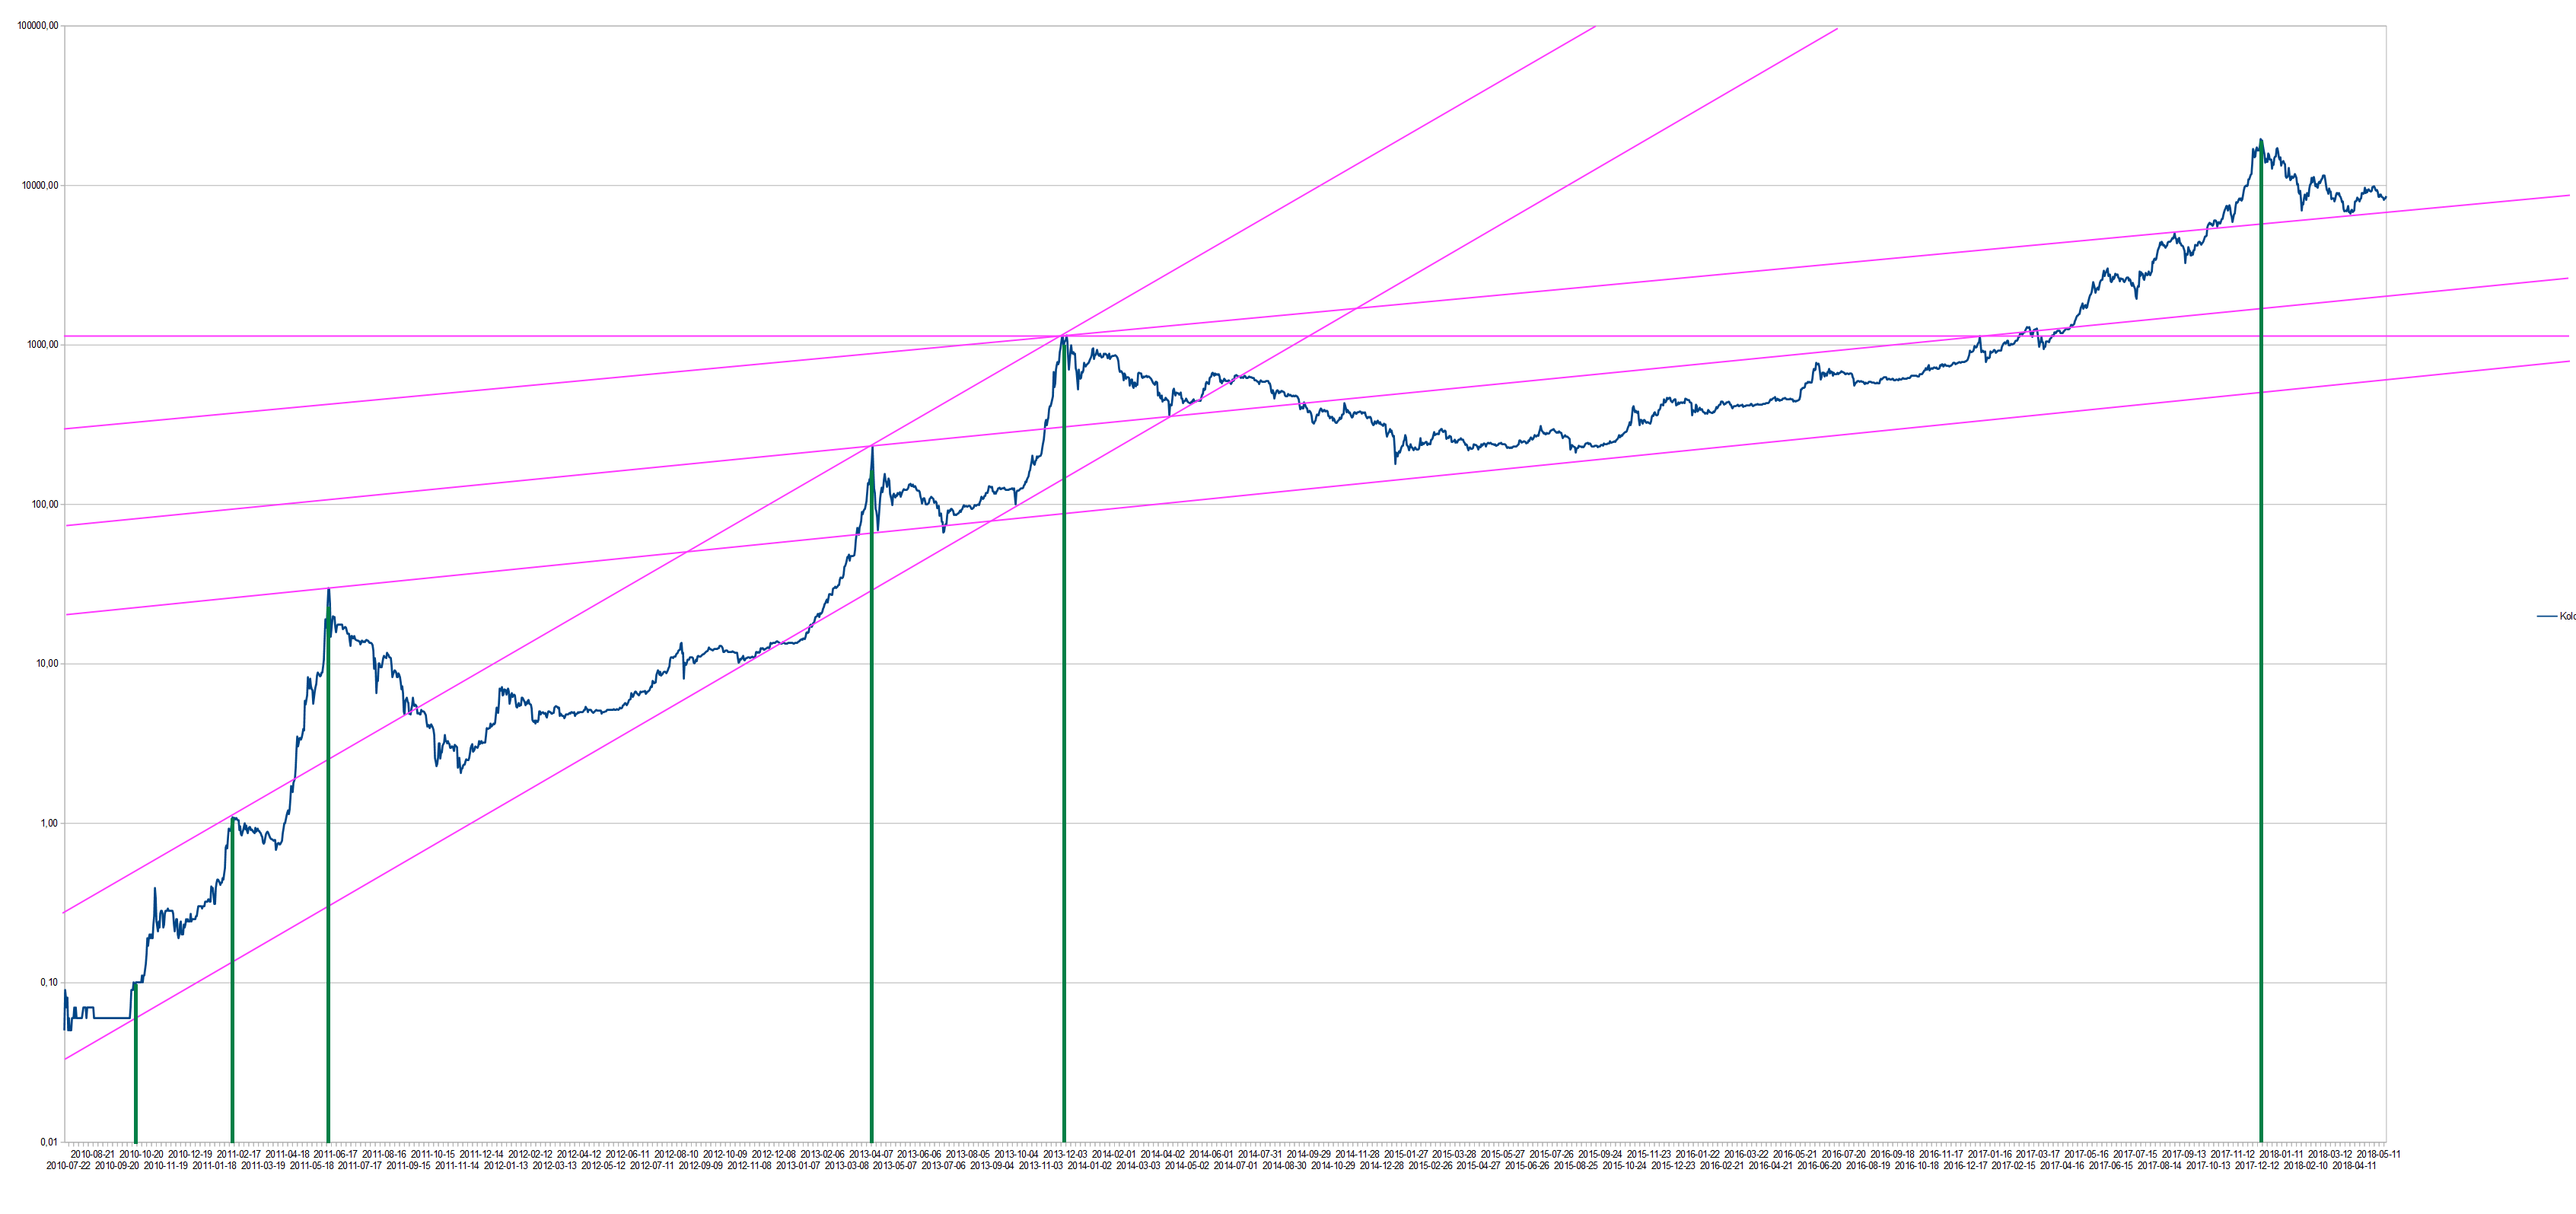
In early 2011 it made its first real bull run, towards the 30$ level, and then fell back, beginning the typical Bitcoin moves.

The average steepness of the Bitcoin price curve seems to decline in time, becoming more flat over the years.
This could mean that big multiplications in value wil take longer and longer in time.
I found some more interesting things through this 'new' 'complete' chart. I hope to bring more updated analysis tomorrow.
First time when I heard about it, it's price was $218.
Was that in April or November 2013 or was it during the half year long bottom of 2015? And what did you do then?
Longer term is the best for bitcoin where everyone just see the gain lol :D
Good chart positions that showing how bitcoin travel his journey from bottom to high .
you sharing very great information of bitcoin chart anylysus 2010..thank you for your bedt informative post..my dear friend.. @pagadance..very well done for your great work..
your welcome
thank you for your welcoming. my dear friend.. @pagadance..
Hi @pagandance we can extrapolate that data and the future looks amazing and even we can use the same analysis to predict some rises in the most important alts. Regards
I think the future for account growth is in trading alt coins wisely. Bitcoin is slowing down.
Excellent analysis and very interesting to see how it all began. Of course, what will happen next is not yet known, but I hope for the best! Thank you @pangandance
for the weeks to come, I expect more of the same
Good chart of btc from beginning to preset
i wish, if i invested on bitcoin then when it was only 5 cents.
Great analysis ..@pagandance It started from 2010 and till now...but so effective ..Graphical analysis is so important for investment and trading.. t
more to come soon