Bitcoin: 2018.04.12 Analysis
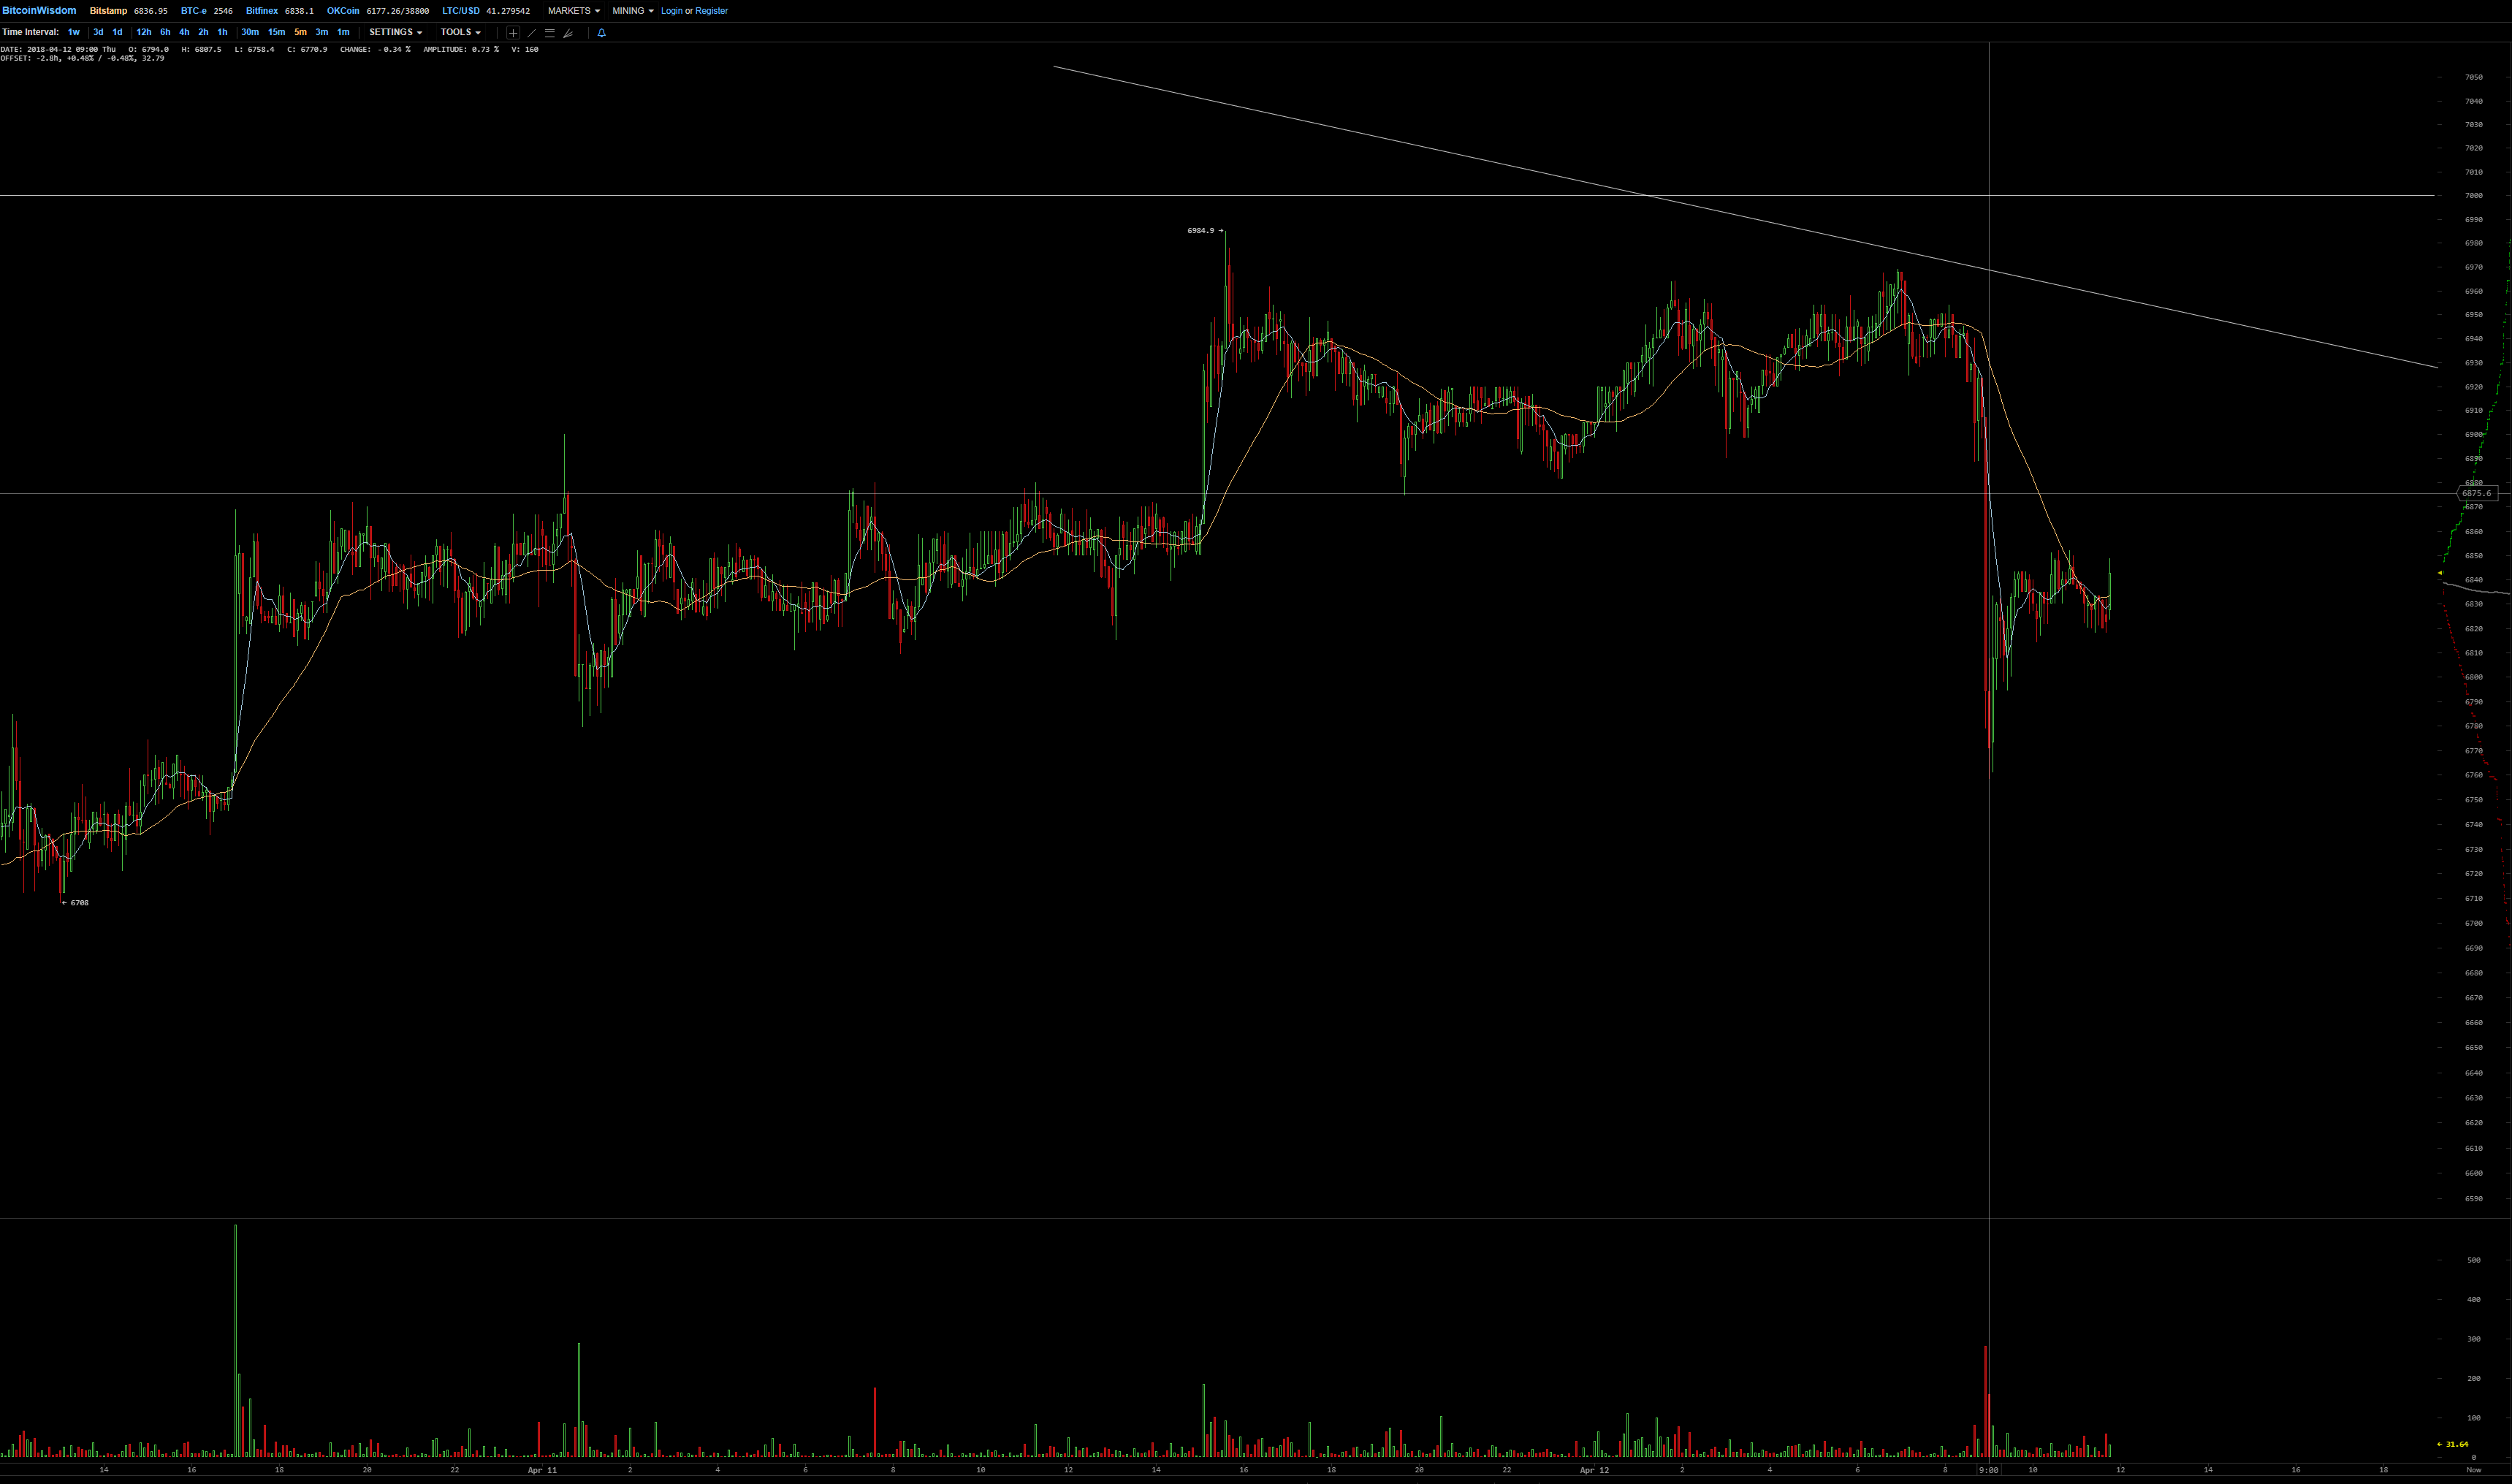
Bitcoin about to break descending resistance line of 5 March. Round Bottom. 7K resistance: will Bitcoin break through or fall down to 5K or 3K?
Logarithmic 4Hours Chart
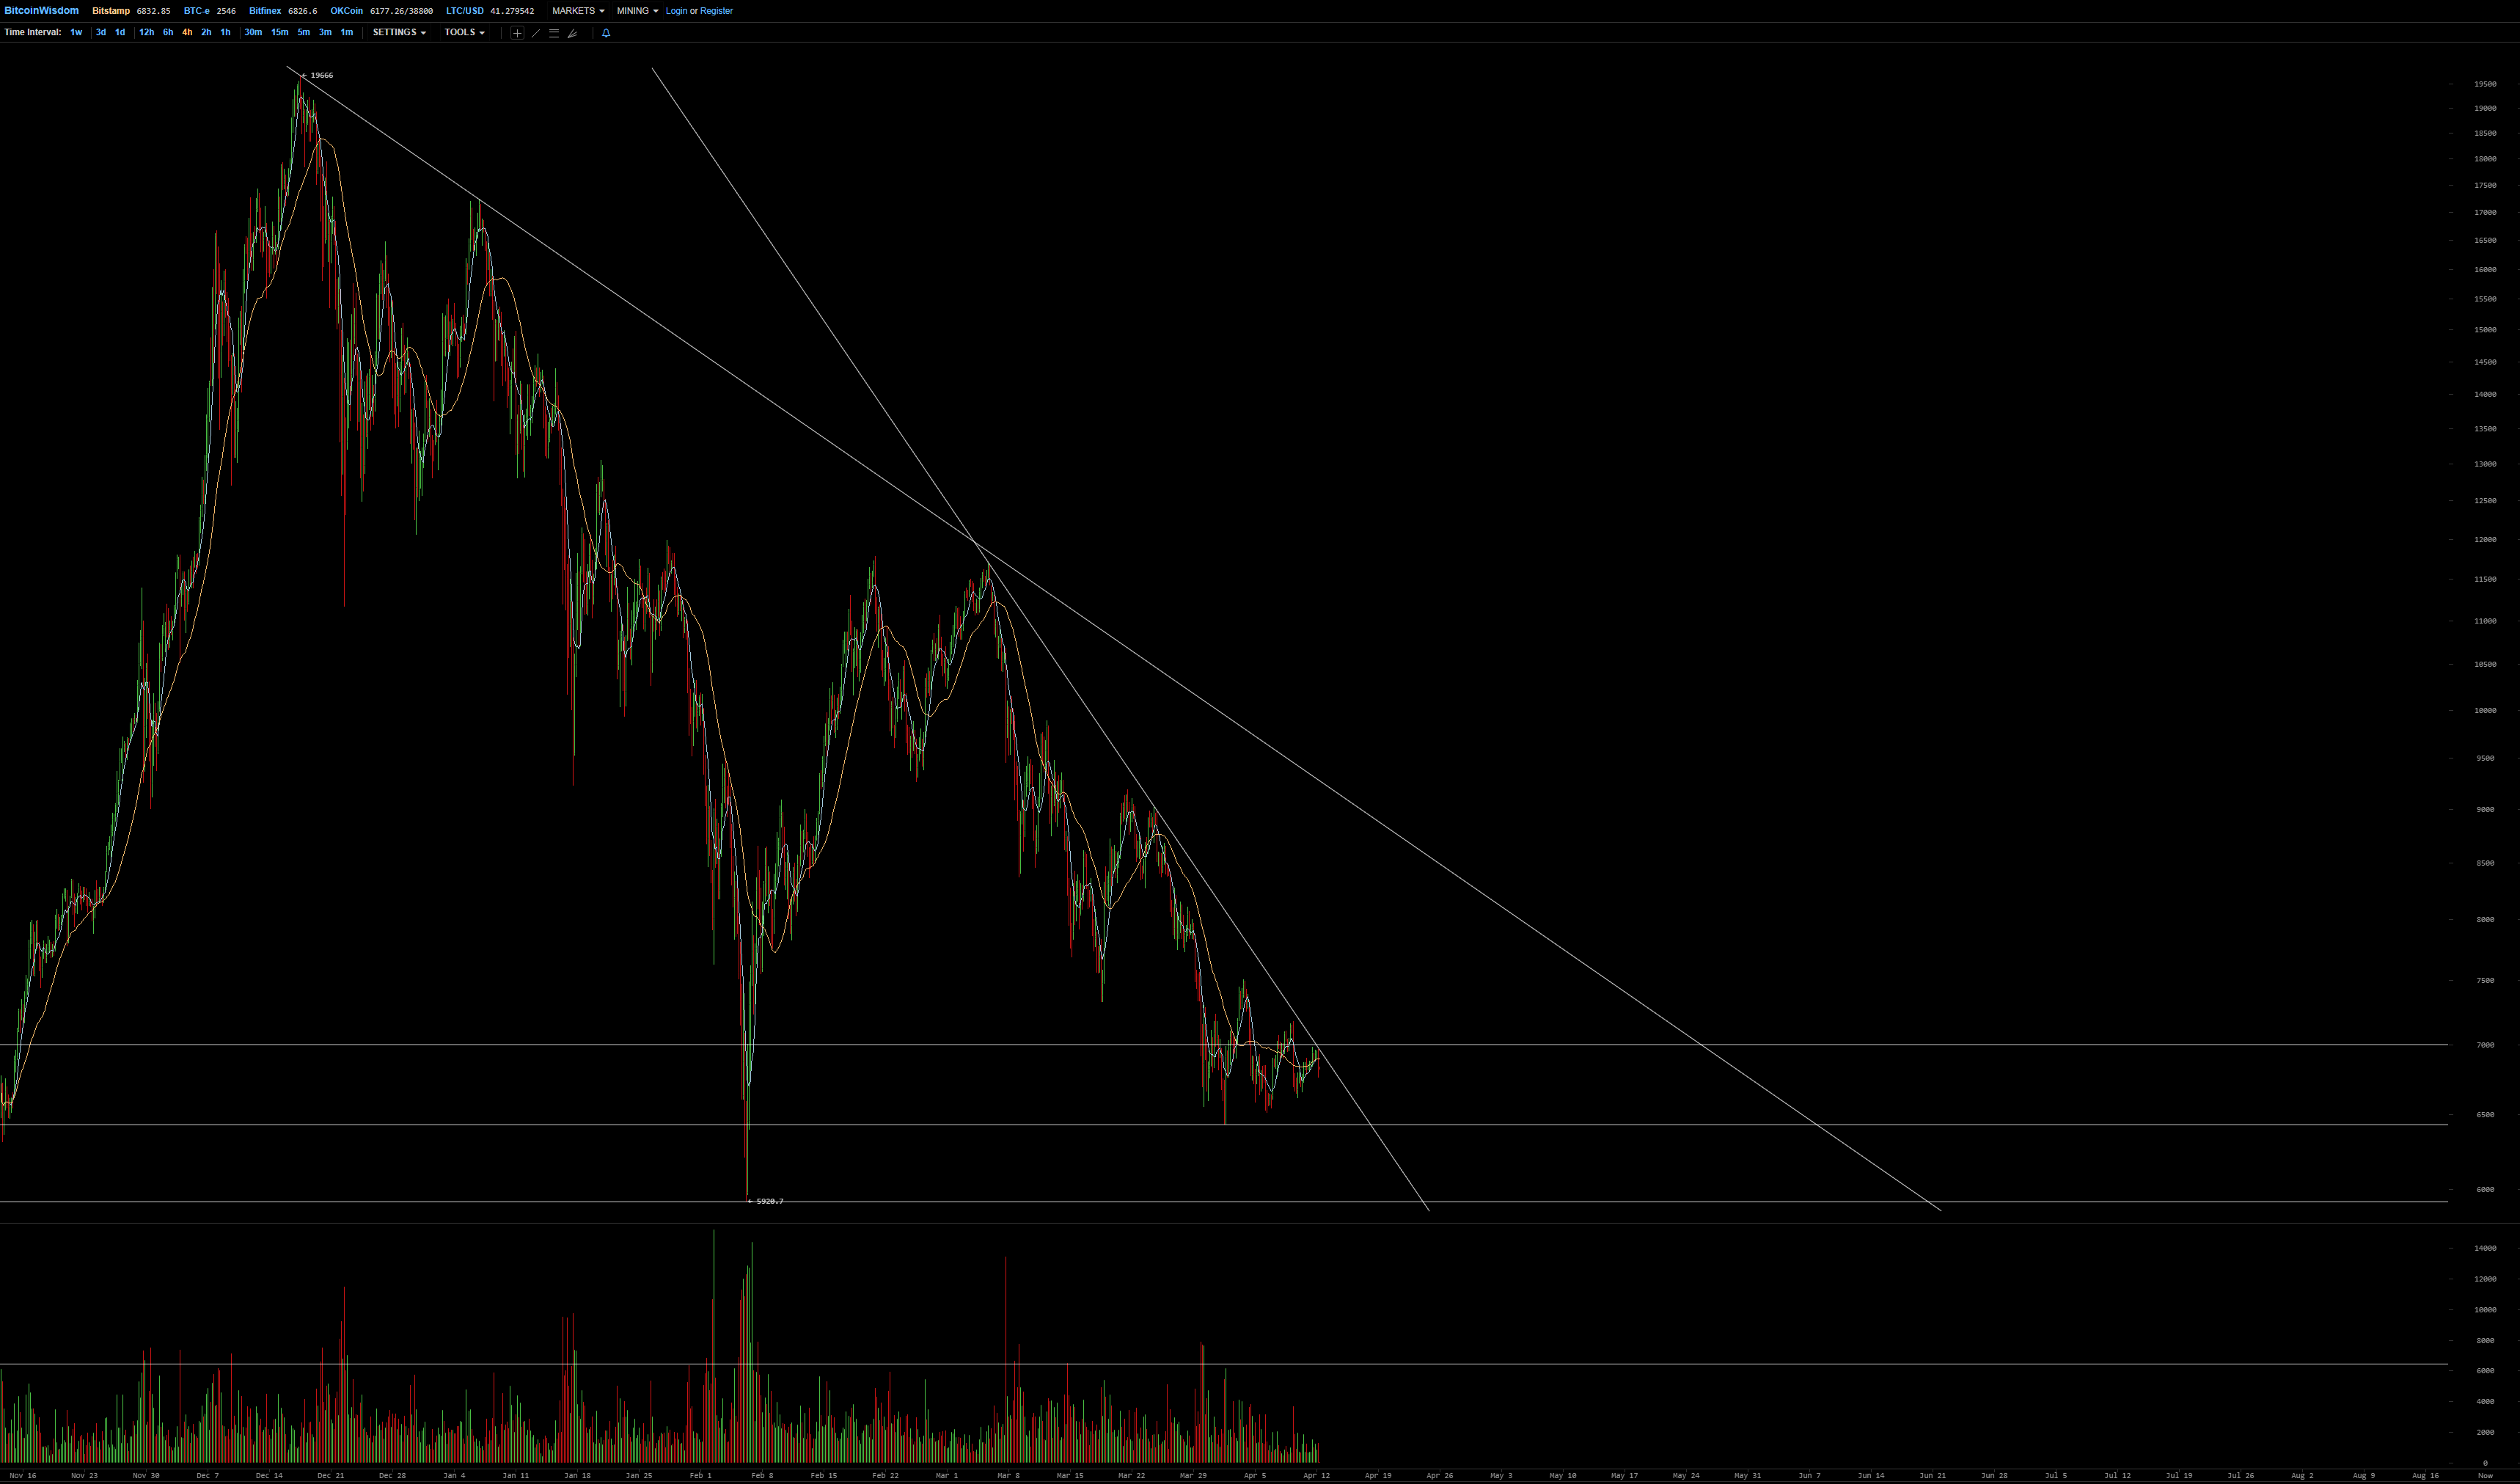
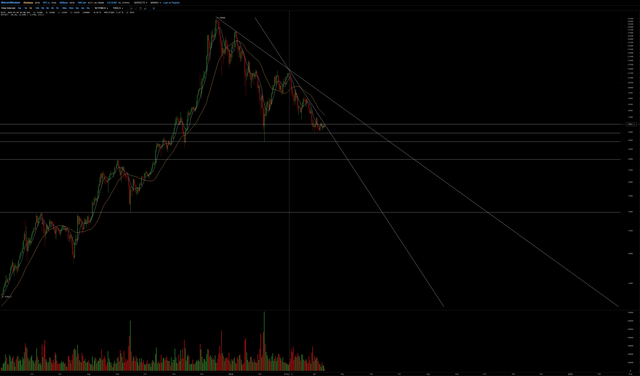
Logarithmic 1Day Chart
Logarithmic 5Minutes Chart
On the Daily Chart it looks as if Bitcoin will break through 7K resistance and go up to 8K-9K to hit longer term descending resistance line.
Before breaking the resistance in Bitcoin. We are seeing great movement in Altcoins.
Great analysis sir...👍
Whenever you see consolidation like the one we're seeing in Bitcoin right now, the most likely scenario is the continuation of the preceding trend. In this case we have no reason to believe Bitcoin can go up and punch through hard resistance areas above.
But it just did :-)
What did I tell you guys? Bitcoin just spiked through the short term descending resistance and through the 7K resistance, all the way through the 8K level :-)
That's a massive pump today that was unexpected :D
When I saw Bitcoin finally getting close to those resistances I thought it would start rising slowly in the coming days, but a +15% spike, hohoho :-)
It seems that BTC may down.
well, it went the other way :-P