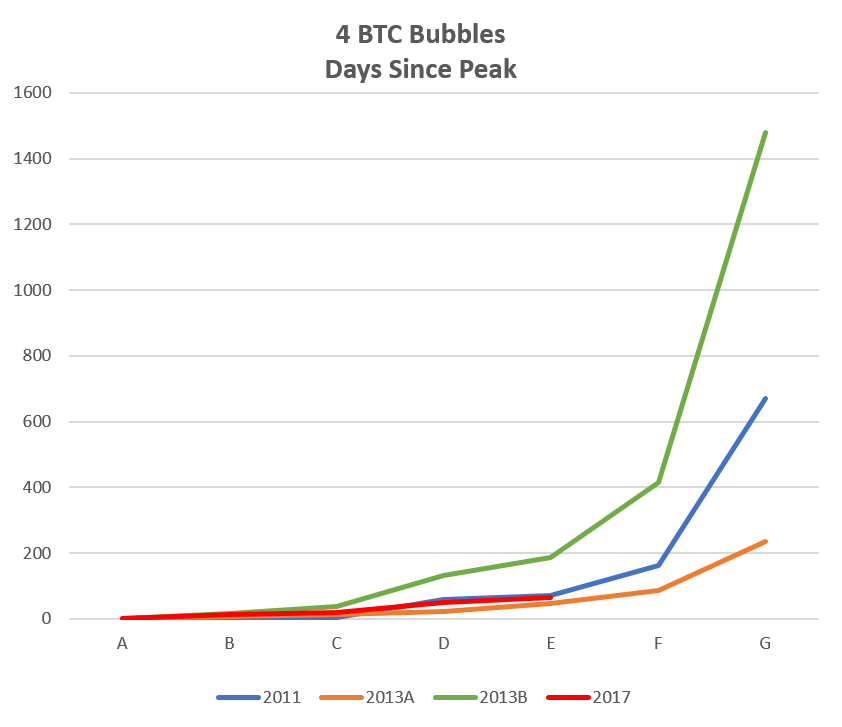
Time and percentage move comparison of the 4 Bitcoin Bubbles
If you bought in at 20,000 USD and are hodling, what might you expect?
If Bitcoin is indeed in a popped bubble and is not done long-term, how long might it be till the next bubble peak? You can see with the past 3 bubbles, the time till the next bubble peak ranges from just under a year (234 days) to just over 4 years(1480 days).

Looking at percentage swings, in terms of the secondary high onward, it has acted more like the second 2013 bubble that took 4 years to get to the next peak.

However, in terms of speed (assuming the points I chose are accurate), it's acting more like the 2011 bubble and the first 2013 bubble, which took much less time to get to the next bubble peaks.
It's possible that it doesn't drop from it's current price, and continues to rise to new highs, calling the last 2 months a correction. Then the comparisons aren't meaningful. But, if it is a burst bubble playing out, we're probably looking at 1-4 years until new highs.
Any thoughts or criticisms?
Congratulations @pablonorm! You received a personal award!
Click here to view your Board
Congratulations @pablonorm! You received a personal award!
You can view your badges on your Steem Board and compare to others on the Steem Ranking
Vote for @Steemitboard as a witness to get one more award and increased upvotes!