Bitcoin Daily Analysis
We continue to divide trade in the silent zone (gray area). This is an area of price that does not concern us. Let the bulls and the bears fight. People are often moved in this area and feel excited to go ahead or sell everything. When you negotiate with emotion, the market usually ends up taking your capital.
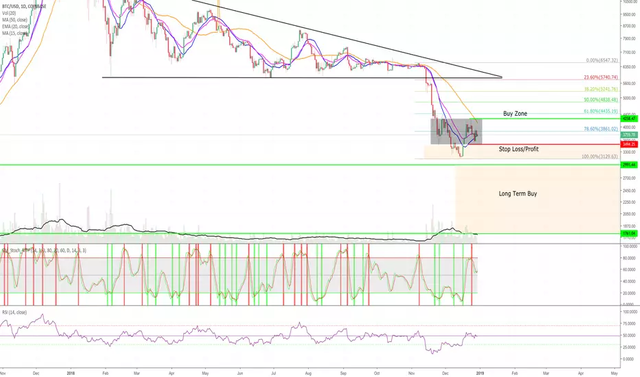
If you bought around the 3.2-3.4 area, you are in great shape. I indicated where you should place your stop loss / profit (red line).
If you did not buy and expect a trend, I listed the first entry point (green line). This is an aggressive target, so please assess your risk / return at this point. Technically, BTC must still exceed 6k so that we can officially say that we hit bottom at 3.1k.
Moving average:
Blue = 15 DMA
Rose = 20 EMA
Orange = 50 DMA
The 15 DMA is about to make a bullish cross on the 20 EMA. The 50 DMA is always down and the 20 EMA is flat. This tells us that bears are trying to keep control, but that sales pressure is weakening. The RSI is still neutral at 50 and has a positive divergence.
At this point, many of us still think that the reverse trend in health and safety will be played out. However, if BTC is below the point where I reported the stop loss stop, this model will become invalid and a new test of the decimal minimums in effect will probably be in place.
Since we are not fortunetellers, I say we are taking our profits and waiting for the next transaction setup, which could happen soon. We will either expect a double significant rebound from the December lows, or, in the unlikely event that we cross the 3 km mark, we will have to wait again for extreme oversold conditions. Even OG HODLer will probably sell.
But I doubt that it will happen. The 200 week MA is sitting around 3.1k and should be a solid support. So I expect a double rebound on this low point and we start to have an upward trend. At best, we all do not know it together and our reverse health and safety model is testing the Fib extension levels up to 5.1k, then back to over 6k.
I can’t see your pic or chart...anything wrong with the image?
Posted using Partiko iOS
That is a Google's format WEBP and is Chrome only.
Neither in Safari...I will have a look at the laptop
Posted using Partiko iOS
OMG I didnt know that only chrome can view these kind of a pictures.
I ll edit it.
Btw @orphism , I think you should consider get in touch or enrolled with https://mentormarket.io/
@timm is a platform of good analyst and mentors on which you could help a lot and get supported by them as well.
Follow the invitation to @timm discord server in case you are interested on.
https://discord.gg/efCyjv