Bitcoin Bottom: Another Point Of View
Let's go straight to the point
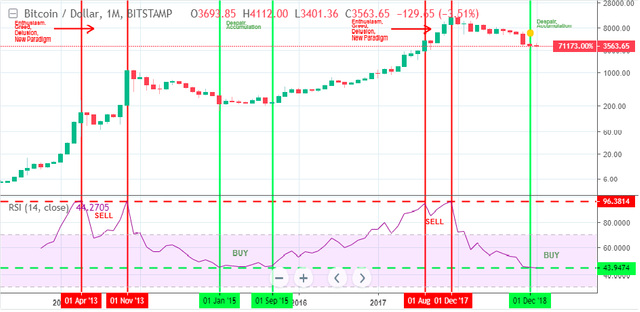
In the monthly chart, the RSI made a Double Top event during the previous economic cycle in April 2013 and November 2013. This was the phase of the 2013 uptrend of Enthusiasm, greed, deception and new paradigm that finally opened the way for the blow of the bubble. Stage and led to the 2014/2015 bear cycle. The RSI made a background sequence in that bearish cycle between January and September 2015, where retail investors reached the phase of desperation, but smart money and institutional investors began to accumulate.
Similarly, in the most recent (current) cycle, the RSI achieved a double stop in August 2017 and December 2017, and last month (December 2018) reached the support of the accumulation phase of the previous cycle. Based on the above parameters, we can assume that this is the current phase of "desperation" for retail investors and the start of the accumulation phase for smart money and institutions that sold the 2017 Double Top.
The bottom line is that a bottom has been formed (always based on that model) and a prolonged consolidation period is ahead until the next bull run.
Man, I sure hope you are right because I just started accumulating again. In the past, I have seen so much chart analysis for crypto that just does not pan out. When we apply chart analysis to crypto, is it really the same as when it is used for stock analysis? Are the trends and fundamentals really the same? I am asking for a friend.
they are almost the same
How long do you think until the price starts to slowly climb and the next bull market starts?
Posted using Partiko Android
maybe a year
What should we do, buy or sell or wait?
nobody knows for sure.
it's not a buy or sell advice,
this may be the bottom, and the best way is to buy gradually periodically.