STEEM - staircase pattern
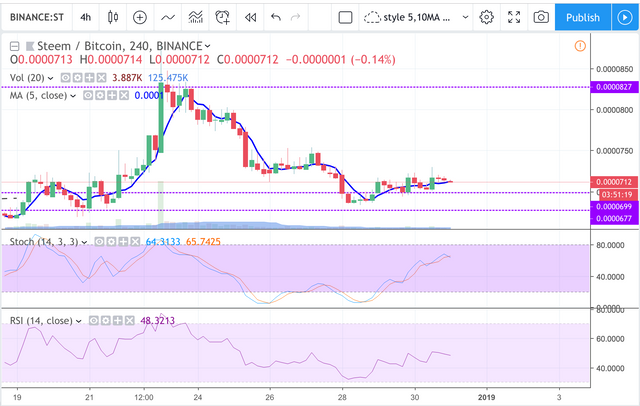
Look like a mini 3 legged staircase pattern on 4hr chart. Need to close higher above 720 next few candles to have the breakout upside into high 700. seller wall around 746 zone. Might pullback after hitting 746 zone to form possible IHS. Buy wall building up around 700
stockpile for short : high (more slow bleed)
Short term moving average (day candle) :
RSI :
SBD/STEEM :
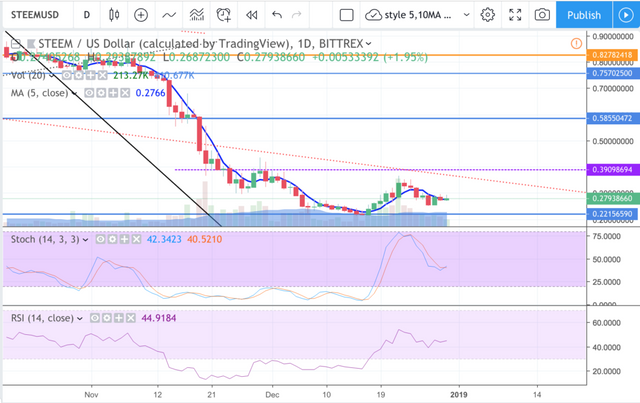
Weekly Timeframe :
24hr change :
Marketcap :84
Volume :127
Current supply :
Total supply :
Debt Ratio :
Daily supply :
Total account :
Published by OnePercentBetter
on

So interesting how perspectives on charts can really be either way... This is a reason I can never trade as I feel that charts are a zero sum game many times. I prefer to scale in at times like these. Thanks for sharing!
Posted using Partiko iOS
yeah different timeframe, tools give users different perspectives.
as long as ya style works keep doing it :)
Posted using Partiko Android
Congratulations @onepercentbetter! You have completed the following achievement on the Steem blockchain and have been rewarded with new badge(s) :
Click here to view your Board
If you no longer want to receive notifications, reply to this comment with the word
STOPTo support your work, I also upvoted your post!
Do not miss the last post from @steemitboard: