Bitcoin Price Analytics
Bitcoin :
Well I have been closely looking at the BTC charts in daily time zone which has been really silent from quite some time now.
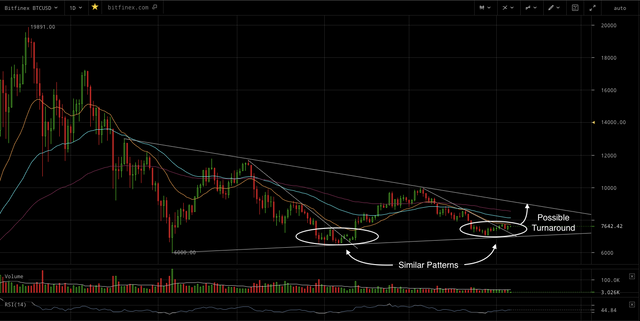
Trading close to the price of $7,600, Bitcoin is consolidating just over the short-ranged descending line drawn above.
BTC in long-range has formed a symmetrical triangle under which there has been two descending line of resistance formed. The first time, when BTC moved over it’s resistant line, it consolidated around 4 days above the range and then gave a positive momentum which eventually lasted almost touching $10,000.
BTC has formed similar pattern on current time-zone which is shown in chart above and we expected history to be repeated and any positive momentum to our previous given upper levels could be achieved. I am expecting that BTC will have a positive momentum in next 48-hours to touch the 50/100 day EMA which lies around $8,100 and $8,550.
My view will be invalidated if BTC falls below $7,250.
Conclusion : Buy either between $7,450 - $7,300 with stop loss of $7,245 or Buy if BTC crosses above $7,750.
Target : 1st - $8,100 , 2nd - $8,550.
Get your post resteemed to 72,000 followers. Go here https://steemit.com/@a-a-a