EOS/XBT (BTC) head and shoulders forming 06/09/18
Check out the EOS - Bitcoin 4hr chart.
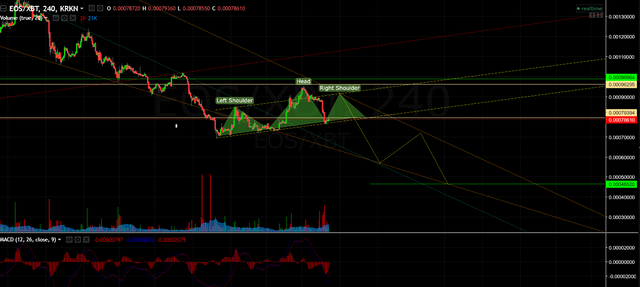
A head and shoulder (HS) pattern may be forming. If the left shoulder forms and breaks the neckline we could be looking at another substantial drop in the price of EOS.
- Top green line (line just above/behind the word HEAD ) - Price I wanted to sell but it did not reach that level.
- Right shoulder top price - Where I am currently looking into selling. This depends on the price action in that area. The HS pattern is only that pattern once it has completely formed.
- Top Yellow Line (Right under the word HEAD) - Price I want to buy back in if the HS fails and the price reverses.
- Bottom Yellow Line (Third line horizontal form the top) - Calculation are based on a neckline break in the HS at that price.
- Bottom Green Line (Last horizontal line) - Price where I would look to go long.
- Also note the MACD. While price is generally moving up (higher highs, higher lows ), the MACD is turning more and more bearish ( lower highs, lower lows )
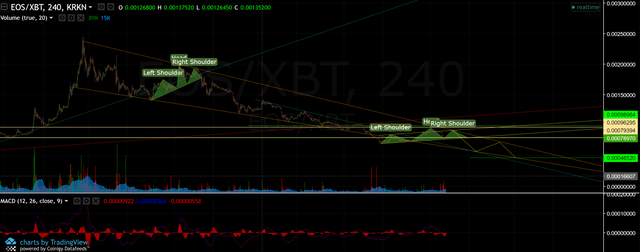
Keep in mind that this is the second HS in this long and thin descending triangle.
This is what is happening now and sentiment can change in a heart beat. News can come out and people may react rationally or irrationally towards it. It has happened in the past and will happen again sometime, someday.
Remember, this is not financial advice, some people say technical analysis does not work, and there are times that patterns do not complete or complete and do the opposite of what it "should". If you have not come to your own conclusion that you should short or go long then do not do it.
Peace, love, crypto.