When is Bitcoin Going to Do Something? BTC Price Analysis Forecast


It seems like a while since we’ve done our last Bitcoin price analysis, and for good reason.
The price movement for Bitcoin has come a crawl! Anyone that’s been monitoring the price over the last few days/weeks has probably noticed that the price of Bitcoin has remained all but frozen in time in the $6.4k-$6.7k.
It appears that the price of Bitcoin has remained relatively impervious to any and all news, opinions, and sentiment on it over the last few weeks as well — positive or negative.
Thus, the question has now shifted from, ‘Where is Bitcoin going now?’ to ‘When is Bitcoin going to actually move?’
The following analysis will attempt to answer that question.
Bitcoin ($BTC) Price Analysis
Let’s go ahead and visit the last chart that we created to refresh our memories on what’s going on:
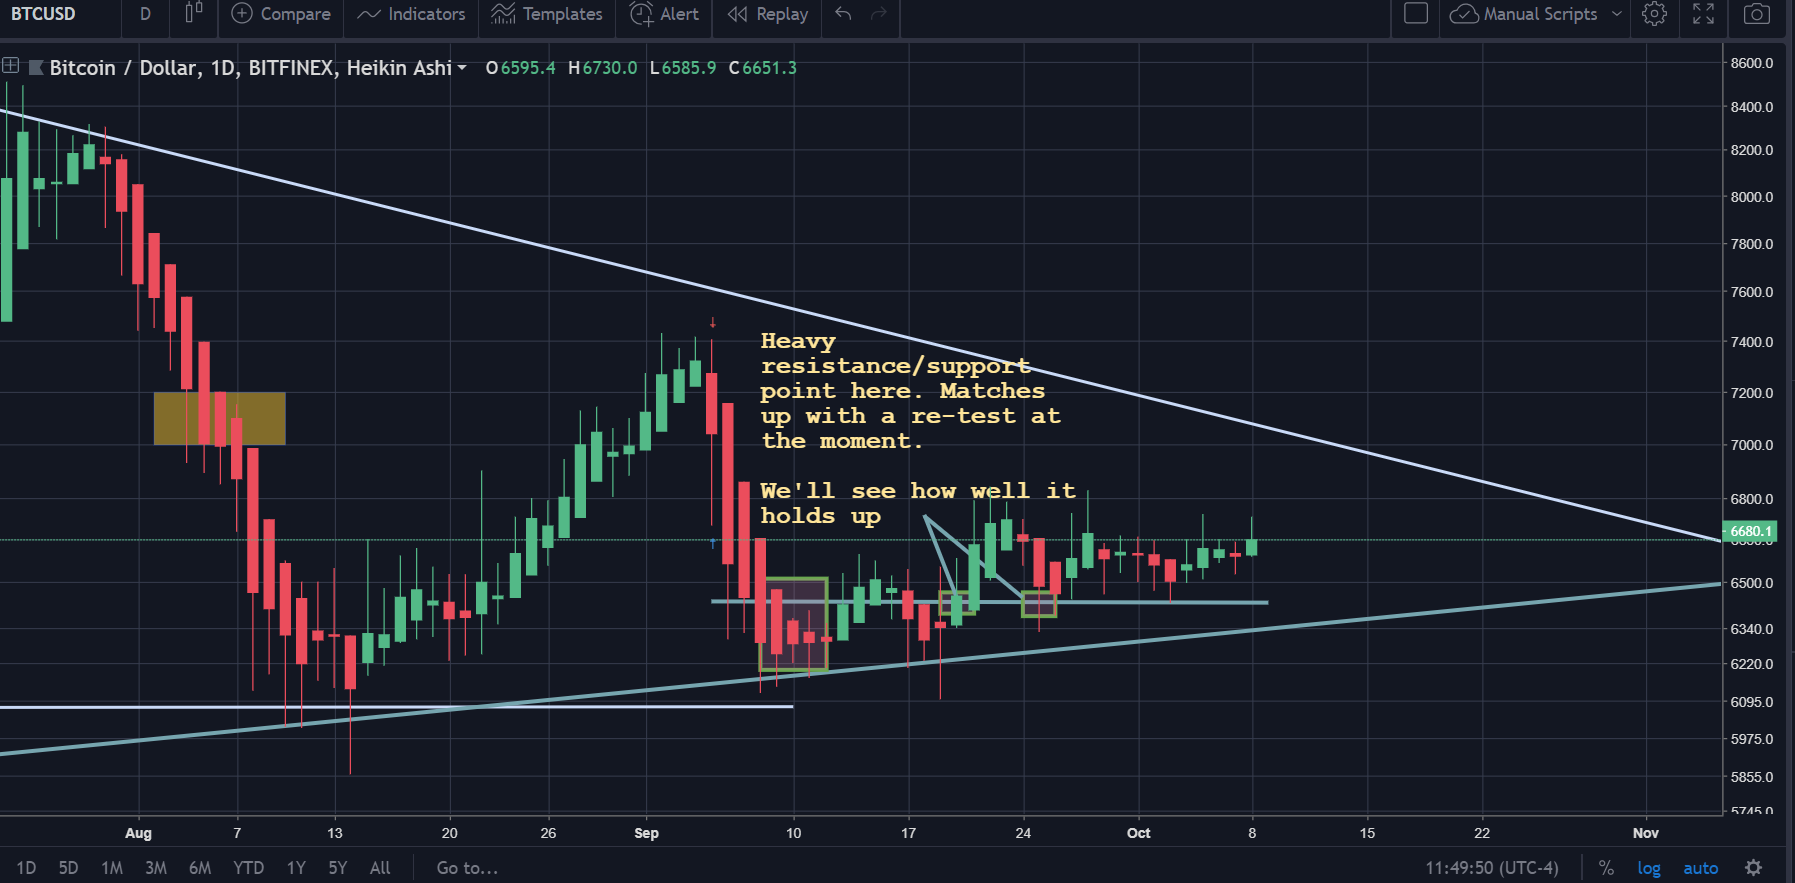
So, as one can see above, the price movement of Bitcoin has remained as still as can be.
Currently, at the time of writing, it is trading at $6,680, which is at the higher end of the range that it has traded in during the past few weeks
Trading Range for Bitcoin ($BTC)
Currently, Bitcoin is trading between the range of $6.2k to $6.7k.
However, it’s worth noting that Bitcoin has been trading in the upper portion of this range over the last few days without a definitive touch down back to the $6.2k level on the daily beyond a couple of wicks.
Acceleration in Price Increase for Bitcoin ($BTC)
After reading the subtitle directly above, you may be thinking to yourself, ‘What Acceleration?’
This is a good question.
Observe below:

In the picture above, there is an uptrend line that is connecting a series of higher lows from June 28th to present time.
Each box in the graphic above represents a ‘higher low’.
Higher lows refers to the phenomenon of each ‘low point’ being higher than the last one. This is typically a bullish development (by itself; bullishness can be invalidated by other concurrent patterns developing on the chart).
Now, when we refer to an ‘acceleration’ in the price increase, we’re talking about the ‘bump’ in that pattern that occurred on September 18th, 2018.

In the chart above, you can see a second uptrend forming on the already existing uptrend.
This is referred to as the ‘bump’.
Unfortunately, Bump and Run (BAR) Patterns Tend Not to End Well
Below is an example of how:
