DONT MISS OUT:: Has the BITCOIN crash ended or just beginning?

Everyone has been anticipating the end of the Bitcoin dumps or crash ever since the end of the Bullish rallly on Dec 17th 2017, which happened to also be my birthday as well :).
From the chart below we can see the previous major Bitcoins dumps
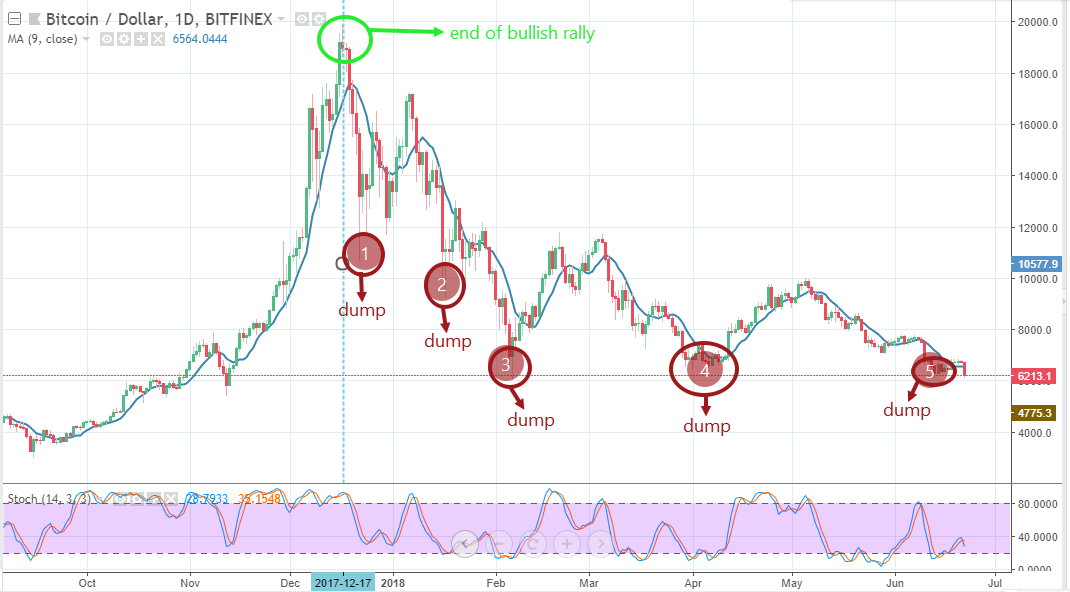
from the image above we can see the several dumps of bitcoins which in most cases happens to be a manipulation of price as the technical movement of price does not corresponds acccurately with the fundamental movement but thereagain in most cases ive always been right with the technical aspect.
However of late weve experienced more positive results for crypto at large and blockchain technology still the price movement has continued to decline.
SO Heres the BIG Question???
Has the Bearish market come to its end or are we still going down??
In order to answer this lets take a look at the bitcoin chart below from a technical aspect

from the chart we can see that bitcoin has completely undergone the descending triangle chart pattern and as well completed the ABCDE elliot waves movement and also from our traditional chart lessons we can also see the consolidation after the breakout below the lower trendline of the triangle which is between the 6000 to the 6900USD mark.
last night we experienced a massive drop from the 6700 mark down to 6100USD which was a heavy movement in the market a lot of amateur traders went on selling of their stocks well not a good idea and not a bad idea either.
From my View of the market i believe we would be going down further to the $4500 mark before we begin the Next Bullish Rally.
From the 2nd chart above we can see the actions which occurred from the previous stochastic levels labelled 1,2,3, and we can see price currently standing at that same level again labelled "4" if history is to repeat itself again which i believe it will we will be seeing a deeper correction to price between 4500 and 4800 USD which i believe will be the end of the BTC correction before the next Bullish Rally.
If my analysis is right which i believe 100% it is we will be seeing a chart like this below 
YOU STILL DONT BELIEVE ME
NOW THIS WILL SHOCK YOU
LOOK at this CHART Detailedly and Comment What you SEE
Does this LOOK familiar
A little advice: Do not sell any crypto at this point the best thing to do is HODL no one knows the day the market will move.

I enjoy analyzing the market and if you do have any coin or currency pair you want me to analyse comment on the session below i will try my best to analyse as much as i can
Please Upvote➜https://steemit.com/christianity/@bible.com/verse-of-the-day-revelation-21-8-niv