Bitcoin - The Inverse Head and Shoulder
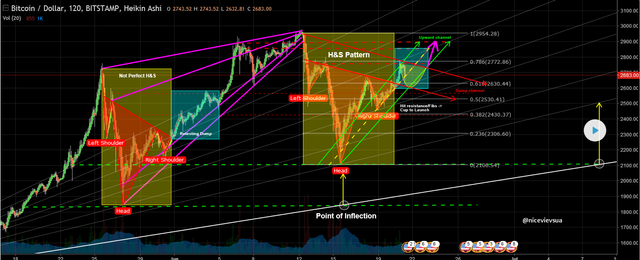
I will be posting new charts more frequently if older once stop supporting the trend lines , the market tends to evolve quite rapidly after all. In this scenario, we see an Inverse H&S , which should normally result in upward price movement. It will retest where the major resistance is aka begin dump and historical resistance points. At these resistance points it will correct, also fibs retracement and will make a cup and handle to break through these upper resistance levels, resulting an end of the dump. We might see a double top forming or it might even break the ATH 0.30% (https://cointelegraph.com/news/suddenly-bitcoin-to-be-officially-legal-in-india) sending it to new levels. For now this chart should support us with bitcoins movement. So stay tuned!
Thanks for sharing such detailed charts. Considering other issues like exchanges going offline which couldn't have been predicted ahead of time do you think this speeds up the correction process we are on?
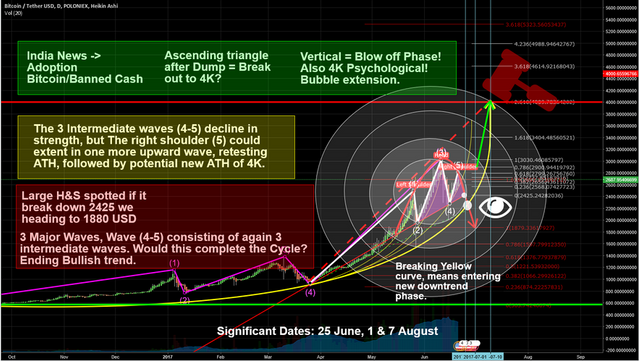
I think that yes, just as sure that the correction should be at 2300
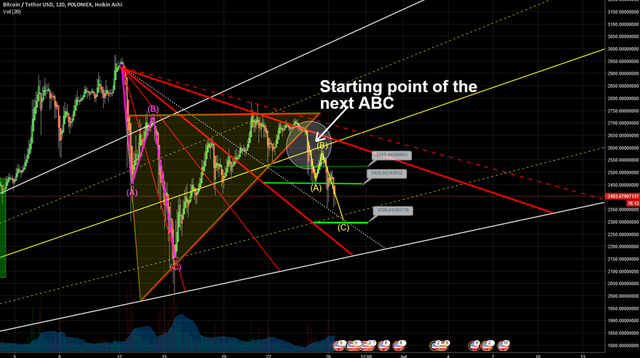
One possible scenario
https://steemit.com/news/@niceviewsua/btc-4h-chart-descending-scallop
Ah thank you for that :) today saw a massive spike in volume as bulls bought the low. I'm curious if that suggests a change in course or if it is temporary. Time will tell, thanks for the charts again
It is very possible that the price stabilizes for a while?thanks for reading :)
https://steemit.com/cryptocurrency/@niceviewsua/technical-analysis-for-today-2-stratis-strat-zcash-zec-bitshares-bts-antshares-ans