Rapid assessment of BTC in 03/2018 period
I spent some time exploring the BTC, and I had some own experience evaluating the development of the BTC. Here is my quick comment on BTC March 03, 1818 and later. The article uses ptkt in my own perspective. Please use as a channel to provide information for your personal arguments. Looking forward to receiving positive contributions and feedback.
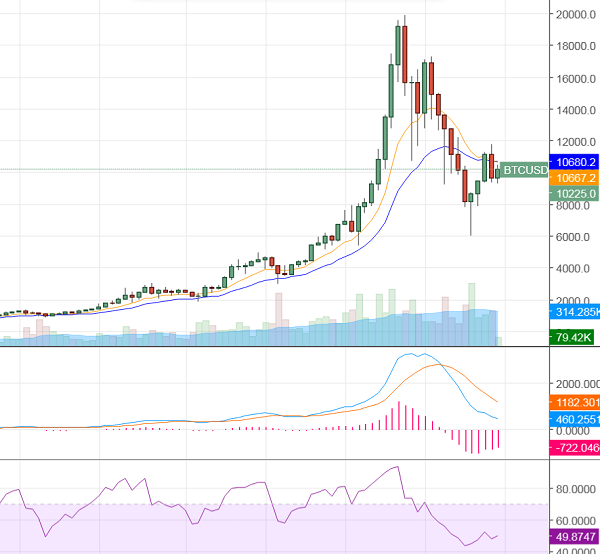
Long-term candles: MN1
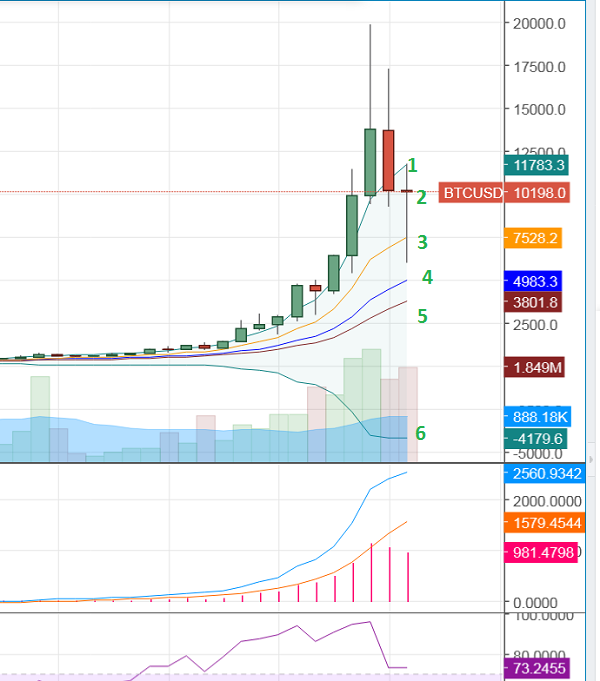
Candle BTC month, frame MN1
The main trend of month candles is still bearish. In long term, the target of the month will be EMA21 (4), BB between (MA20 - 5), and finally the bottom BB (6). During BB bottoming process (deep down, BB bottom will be pulled up gradually by the falling candle / sideway), the price will fluctuate in BB is the main. So in the month frame we will be very long to see the new peak of the BTC (Over 19k8).
About February price movements: After forming a very deep bottom, the candlestick month reversed to Doji and the rising trend to touch the BB, basically it moves quite well with normal candles.
Thus, the end of month candle is nearing end, in the case of green candlestick close (more than 10,268), a slight increase cycle will continue at the beginning of next month before continuing to fall. Target in this case continues to be BB on (around 12k5). If the red candlestick is below 9K3, then the next target will be EMA10 (3) and then EMA21 (4). For indecisive candles of 9K6 - 9K8, bearish trend will be a priority. Observing the February candlestick with the oversold EMA10 (which broke short-term support), the price will likely advance to the next support (EMA21).
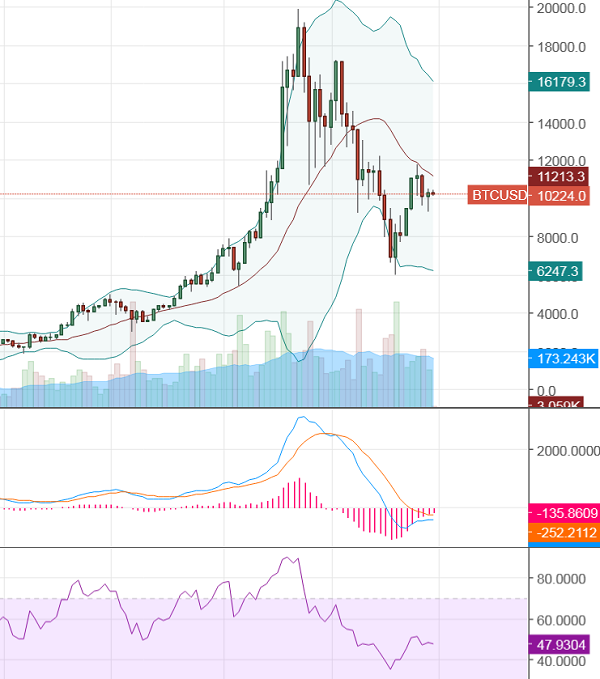
Medium candle, W2 (2 weeks)
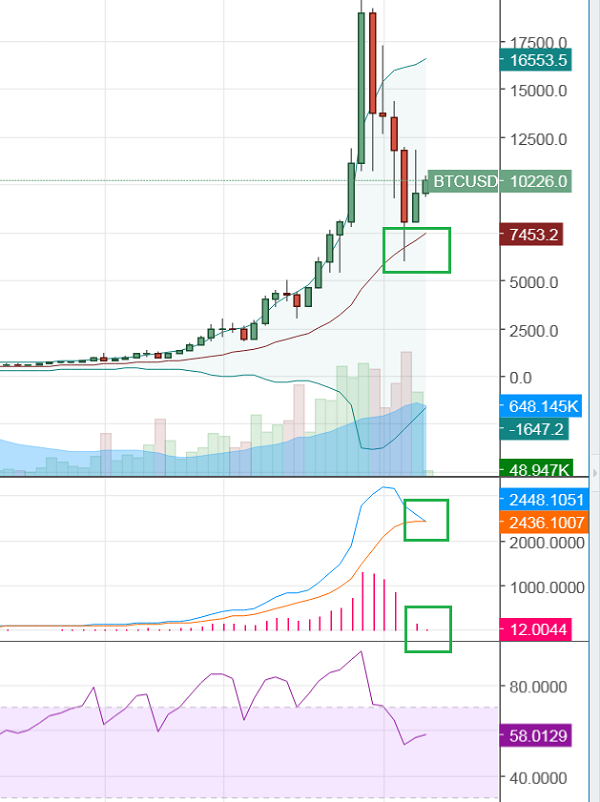
- Candles continued to show that the long-term trend of BTC is still down. You can compare the previous week's candles to the previous period to visualize the two candles of the week. With the MACD approaching intersecting, the histogram approaching 0 indicates that we will have a 2 week candle with a continuous rise and fall of the Histogram column (ie, positive, negative). Normally, the candle 2 weeks later will be the red candle, ie 12/03 onwards will begin to notice clearly. The first goal will remain the middle BB. Basically the price rarely hit the BB between only once and then immediately up, usually at least 02 to 03 times back. Two weeks of candle is quite good, however, the previous candle tree is quite long, this candle can hardly increase.
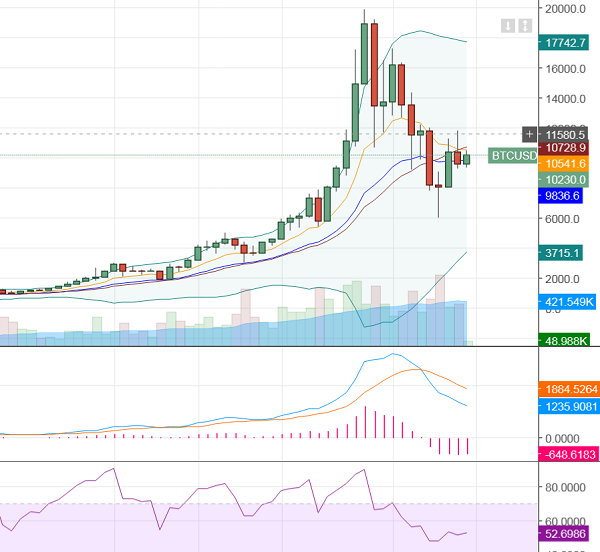
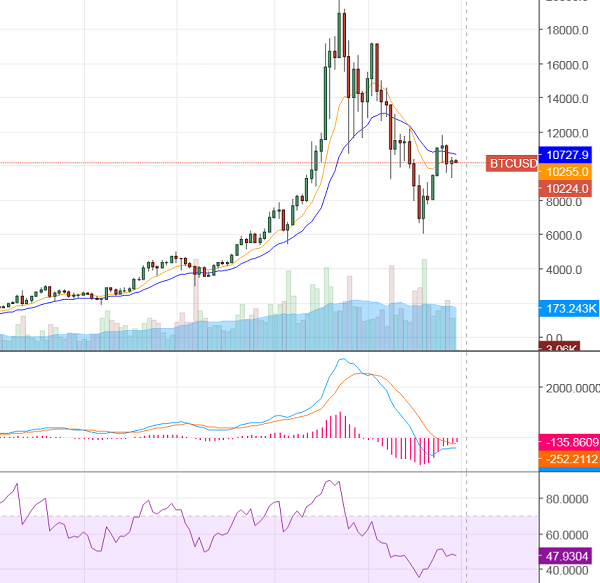
Medium candle W1
- Back to candle week, after falling very strong BB bottom of candle week was painted very beautiful. From negative to advanced $ 3700 and continue to open up the opportunity for price advancement to the bottom BB. Both BB candles are currently supported by sideways prices around the middle BB area. EMA Cross (10/21) support downtrend with narrower narrow band. Prices are very strong and most of them are not maintained in the middle BB.
Near-term D5 (5 days)
- D5 with the cut of EMA Cross continues to support the long term bearish trend. After tree D5 on 25/02, Cross has officially occurred. However, the interval between the two EMAs, but not yet cut, creates two close EMA lines) is too long, so the EMA Cross could be turned upside down in several candles. Thus, the D5 frame signals a slight increase before the long drop.
Candles on short term D3 (3 days)
Candlestick D3 also showed that the main long-term trend continued to decline with all three BB lines, especially the MA20 with very clear slope. The bottom of D3 continues to open and offers the opportunity to appear Double Bottom. However, we only need some sideways candlelight candlesticks and the bb bottom is pulled up and the BB continues to lower the opportunity to price up BB. The short term uptrend in D3 is sideways around BB long enough. Now if the price up quickly, it will collapse very quickly, the price will fall down, the bottom BB will open to create a downward trend immediately.
- D3 with EMA cross (10/21) shows that prices are still easing when prices remain below EMA21. However, the case of rising prices strong enough to reverse the situation may also occur. Currently D3 is still in the 50/50 trend for short term.
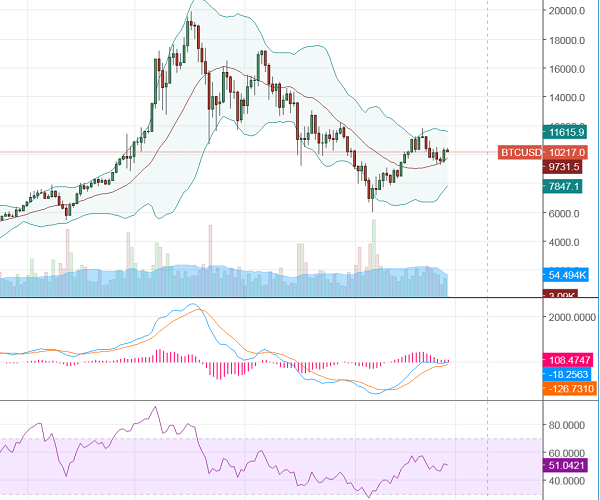
Short frame D1 (1 day)
D1 is one of the brightest frames for BTC with the MA20 (middle BB) curved upwards. In the latest downtrend D1 has not broken the middle BB. D1's price is also pretty bright for some models such as Head and Shoulders, Cup and Handle.
Data integration and personal assessment
On 01/03 (new candles) have come very close, the current frame D1 shows that prices can hardly fall sharply. Opportunities close Doji candles are relatively high, and we may have short-term gains with BB expectation on the candlesticks or higher around 13k7. This is basically well suited for short and medium frames. Then the trend of falling back and approaching support in turn varies.
It should be noted that the analysis of nature is not valid at all. Signals are the most important thing when the market changes continuously, the price of closing the candle can completely reverse the trend. Use for reference information, then combine the signal at the present time to make a decision. In this market should not believe anyone, including myself. Use information independent of your logic.
Congratulations @nguyen-land! You have completed some achievement on Steemit and have been rewarded with new badge(s) :
Click on any badge to view your own Board of Honor on SteemitBoard.
To support your work, I also upvoted your post!
For more information about SteemitBoard, click here
If you no longer want to receive notifications, reply to this comment with the word
STOPThank you.