Bitcoin $BTC Daily Golden Forecast Indicator – How to Use Information Provided
Many technical analysis methods don't work well in today's markets (perhaps they never did). For the past 20 years, I have studied market price data and methods used to numerically measure market movements. Several years into my study of the markets, I realized that many market methods just don't provide any viable edge. That set me on the path towards developing one that does work. I am cautiously optimistic that I have succeeded.
I developed the “Golden Forecast Indicator” as a result of the realization that most numerical technical analysis are inadequate as a method of measuring and forecasting market moves. The “Golden Forecast Indicator” is purely mathematically generated. No emotions, fine tuning, curve fitting or training are involved. The only input into the algorithm is daily closing price data.
One key feature of the “Golden Forecast Indicator” - the signals it provides do not change with the addition of future data points. Many systems look great on paper, but fail in reality due to this. There is no “redraw” of past signals using the “Golden Forecast Indicator.”
One key thing to remember – forecasting is not prediction. Forecasting is the art of discerning potential possibilities with a high probability of occurring. It is about measuring changes in the marketplace and then taking appropriate actions based on those measurements. Forecasting signals can and often are invalidated because new information or events enter the marketplace. The edge forecasting - based on price can provide – is to let one know about the impact of news or events without actual knowledge of the news or events directly. Then one can act accordingly... If the weather forecasts thunderstorms for the day – don't go offshore fishing.
How to Use the “Golden Forecast Indicator”
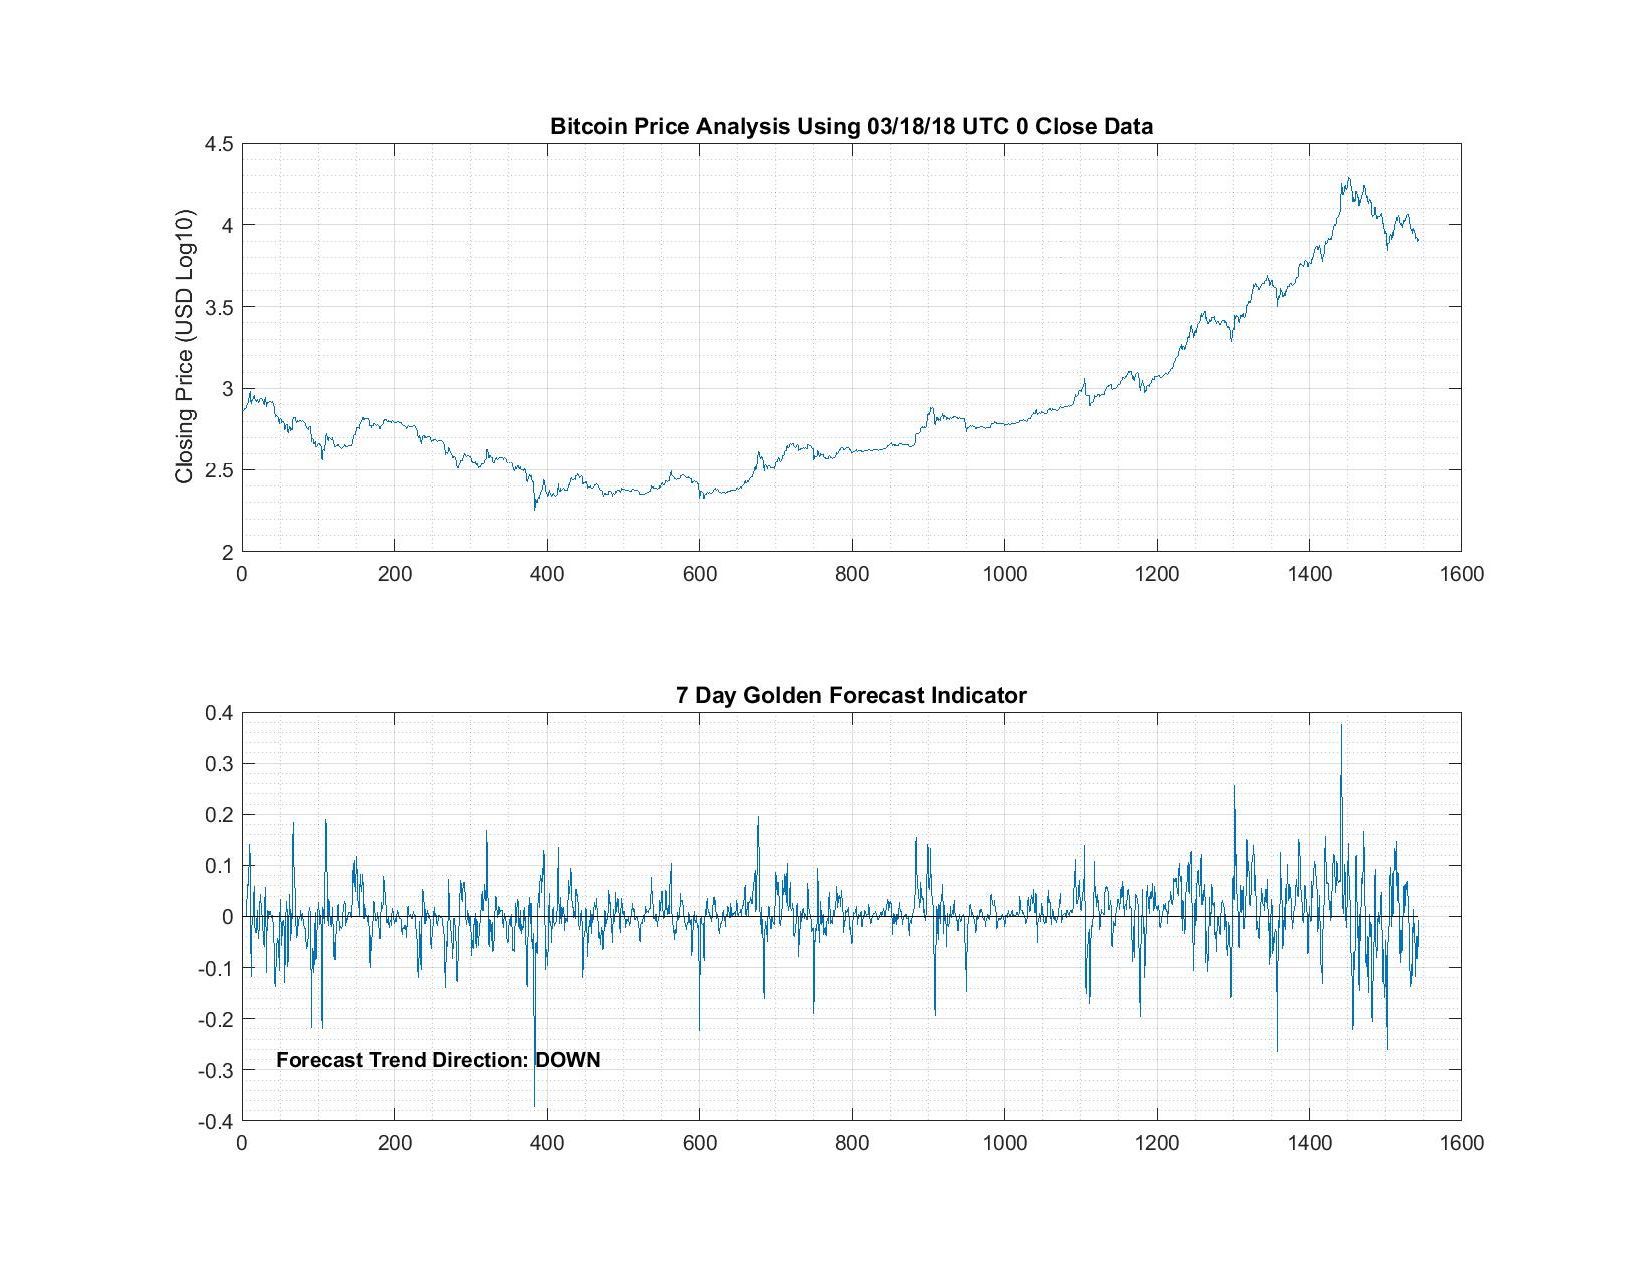
The upper graph is of closing prices adjusted using Log10. This price data is included to allow you to see current and past price action vs the “Golden Forecast Indicator” in the lower pane. This allows one to see how the indicator would have done historically. Note: Historical results do not guarantee future results. However, history is said to repeat itself and human nature does not seem to change much over time (without massive reason to do so).
The lower graph is the “Golden Forecast Indicator” which uses the adjusted closing price data to numerically compute the indicator. The number of days used to compute the indicator are displayed in the title of this second graph.
On both graphs, the oldest data is on the left hand side and progresses to the latest market pricing. At this time daily data is obtained and used to calculate the indicator at UTC 0 each day. Data providers usually don't post the last days data until UTC 2 each day. Therefore updates will be created once official data is released after UTC 2. This process is not automated at this time and is done manually.
Using the “Golden Forecast Indicator” is easy. If the blue indicator line is above the dark “zero” line that indicates an upward forecast. If the blue indicator line is below the dark “zero” line that indicates a downward forecast. For simplicity sake, the charts also include a “Forecast Trend Direction: DOWN” or “Forecast Trend Direction: UP”. This is automatically generated for each chart and should be relied upon when in doubt. Changes in trend direction (UP to DOWN or DOWN to UP) might present the "best" investment opportunity and timing.
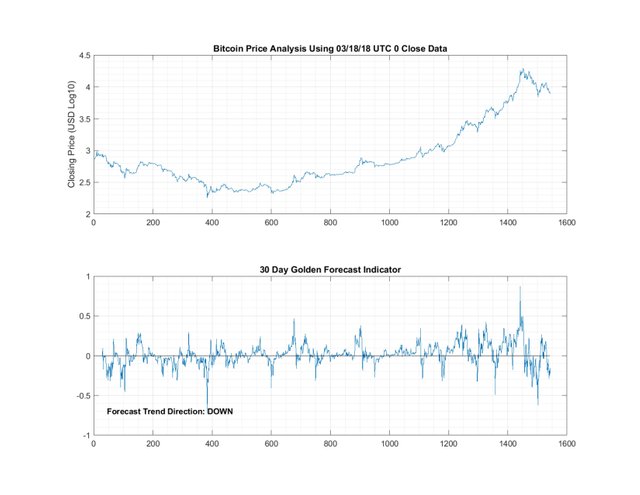
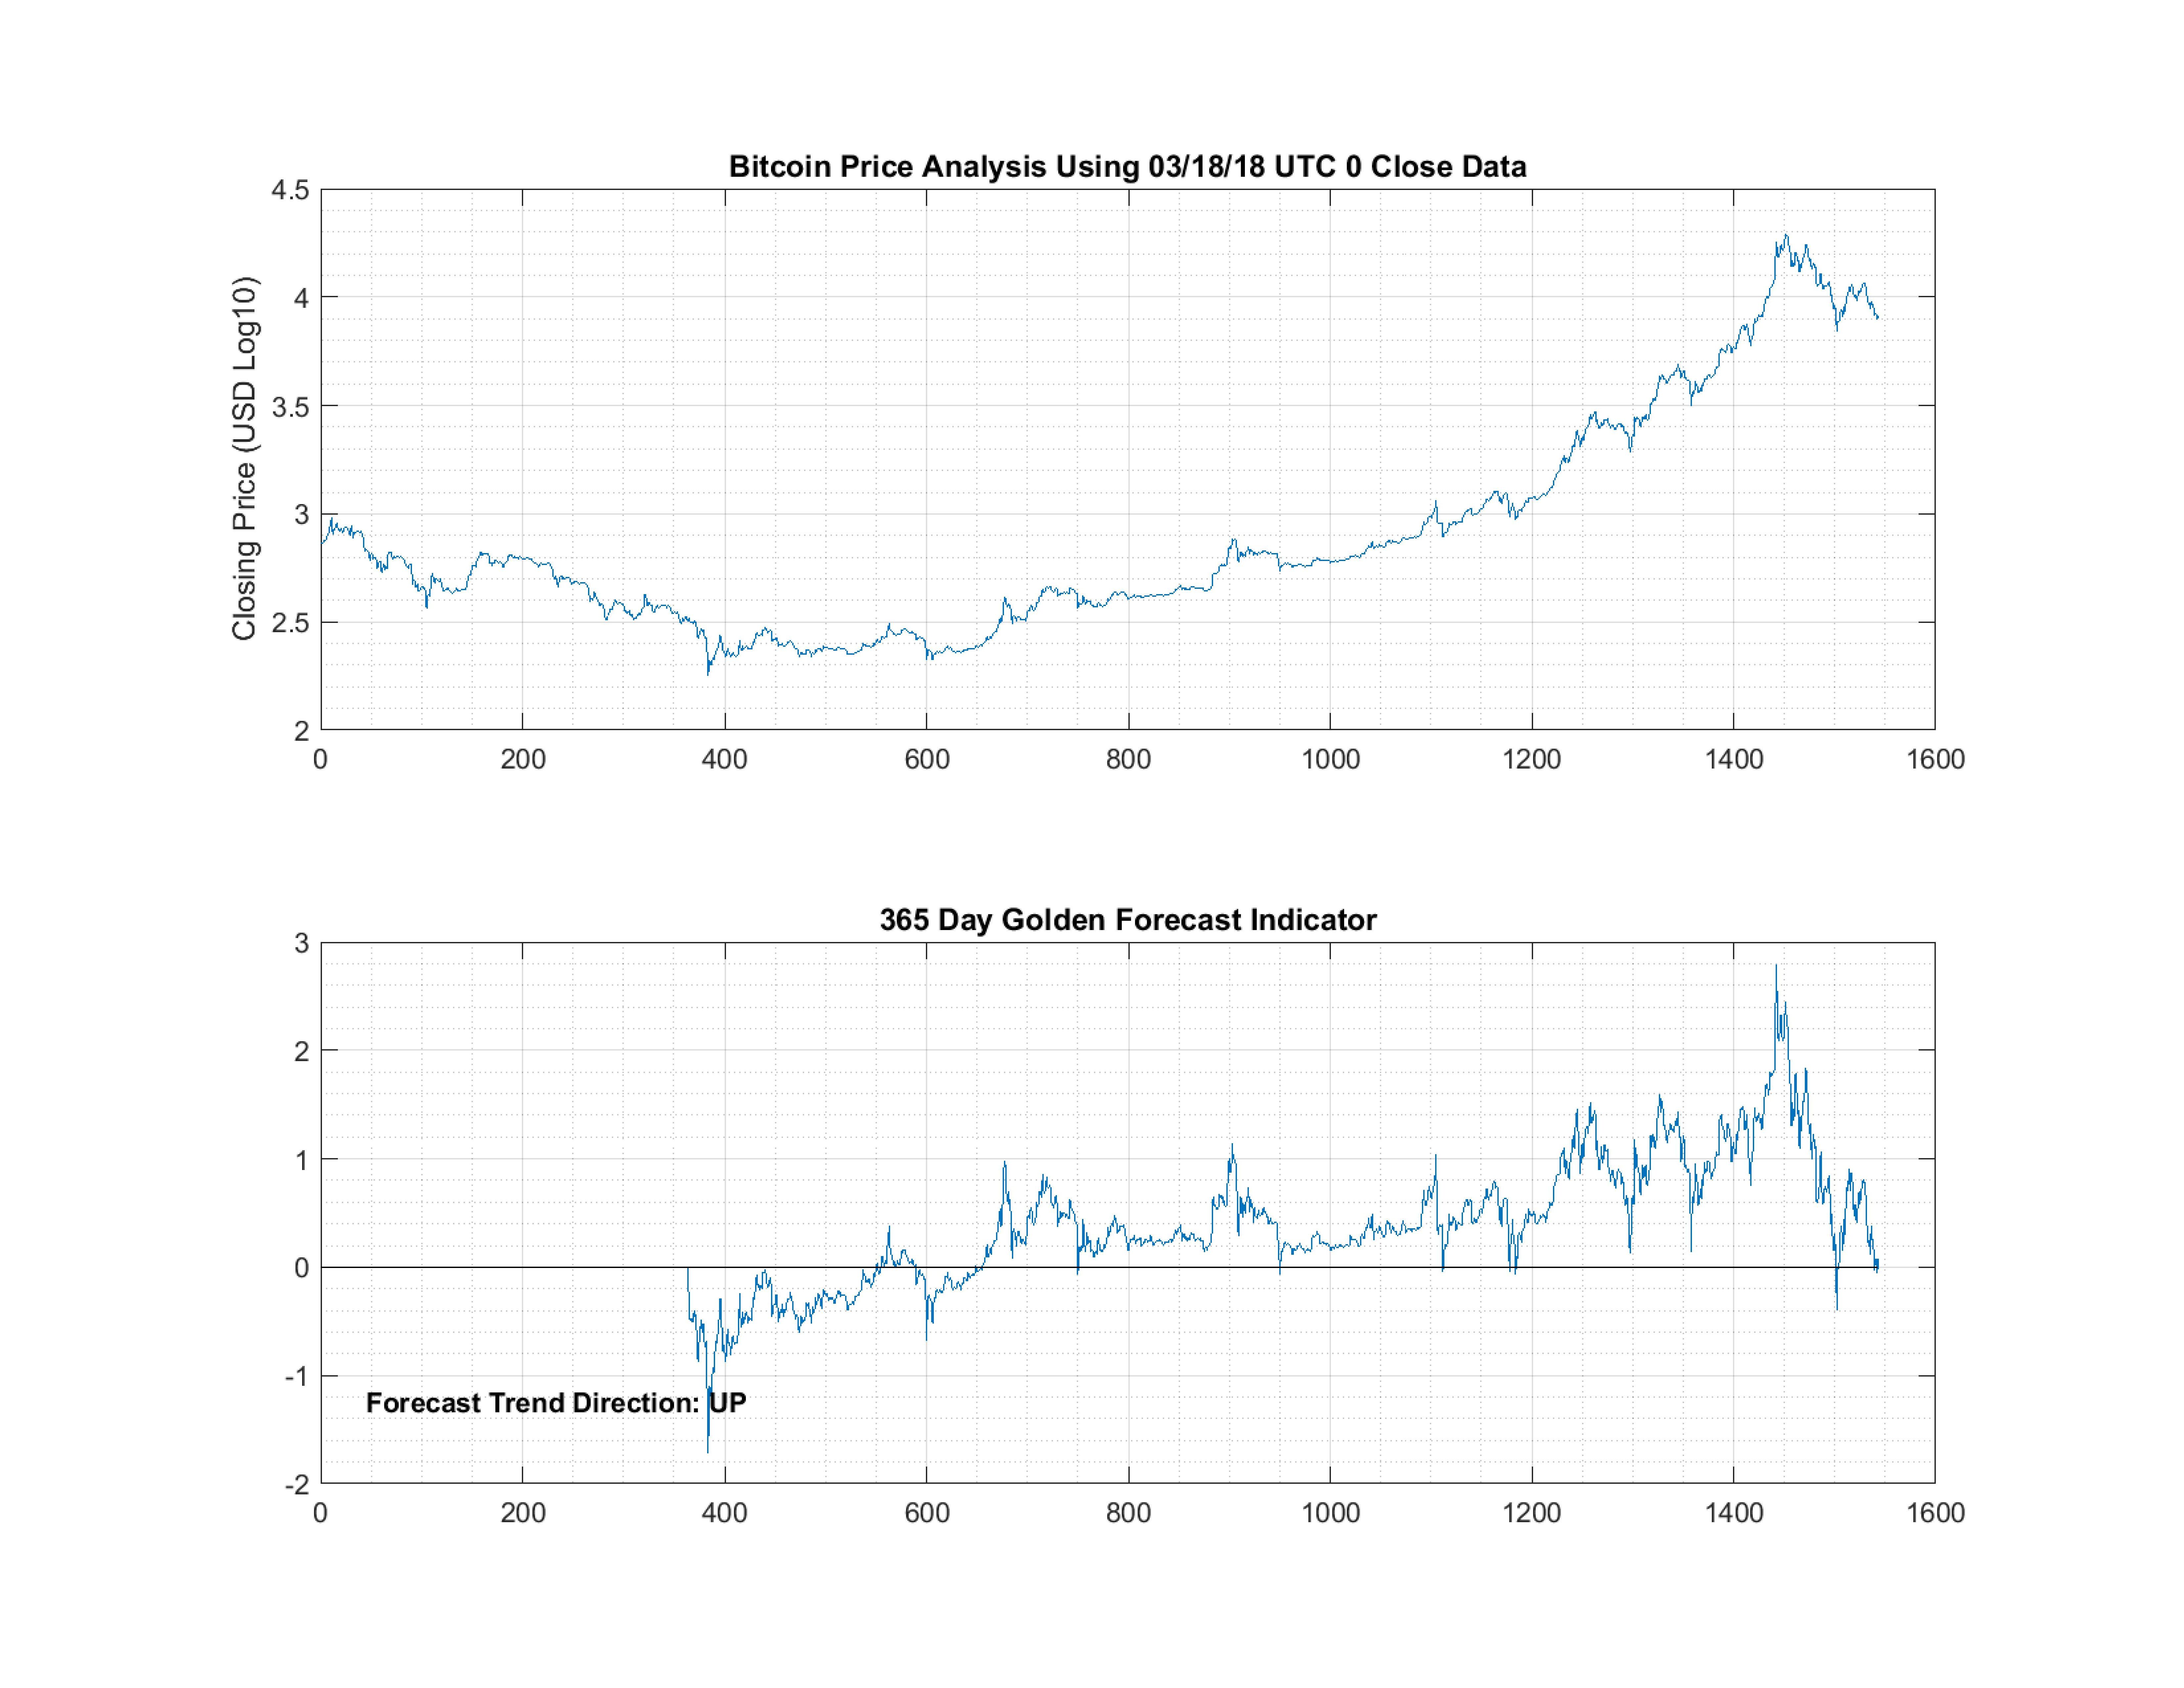
The 365 Day forecast indicator is based on 365 days of price data. This creates a longer term view of price action. It is not necessarily a 365 day forecast, but a forecast indicator which uses the past 365 days to create its current daily forecast. The 7 Day indicator uses seven days of pricing data, the 30 day indicator uses 30 days of pricing data and the 365 day indicator uses 365 days of pricing data. This creates a short term, mid term and long term indicator system. The short term indicator will give quicker response, but many more signals (a change in direction) than the mid and long term indicators. By looking at the historical signals generated, you can choose which indicator you would like to use and stick with it. Hypothetically changing your positions when the indicator direction changes.
Another way the indicator system can be used - let's say that on fictional ABC coin - today's analysis shows 7 Day Forecast Indicator Down and 30 Day Forecast Indicator Down and for simplicity this coin does not have 365 days of data - so the 365 indicator is not available. Tomorrow the analysis shows the 7 Day indicator is UP and the 30 Day indicator is still Down, but approaching the zero line. A way to trade this potential turn around might be to go long ABC based on the 7 Day short term indicator change. Stick with the 7 Day indicator until either the 7 Day indicator flips Down again (selling) or the 30 Day indicator flips UP - then sticking with the 30 Day indicator for direction... The point here is there are many ways to use the indicator system. Indicators are just one piece of a valid trading system. The indicators are reactionary to market price action on a daily basis and change on a daily basis (potentially reversing direction). They are essentially mathematical trend detectors and detect changes in the overall trend on multiple time frames. It is important to check the market forecast trend directions daily to use correctly. Its is also important to realize that smaller time frame indicators change more frequently than larger time frame indicators. Smaller time frame indicators also cumulatively influence larger time frame indicators as well.
Plans for Bitcoin Forecasting:
Current plans are to generate indicator charts for the top 10 market cap cryptocurrency coins daily. The list of coins followed will be generated each Sunday. Changes in coin capitalization during the week will not affect the coin analysis list until the following week. The charts are described briefly below:
7 Day Indicator – This should be useful to those planning short term market entries and exits. The seven day indicator will change more frequently than the 30 or 365 day indicator.
30 Day Indicator – This is a intermediate range forecasting tool. It will change less frequently than the 7 Day Indicator, but more frequently than the 365 Day Indicator.
365 Day Indicator – This indicator is a long range forecast tool. It will change less frequently than either the 7 Day or 30 Day Indicators.
I will make every effort to post these charts as soon as possible after UTC 2 daily. If you appreciate my efforts – please follow, up-vote and resteem – as this is how I am rewarded for creating and sharing this information.
Terms of Use of the Golden Forecast Indicator:
I am not an investment adviser. I am not offering any recommendation to buy or sell any commodity or security. The Golden Forecast Indicator appears to be a highly useful forecasting tool – much like the morning weather report is for your daily plans. The “Golden Forecast Indicator” is offered as a informational and educational product regarding current market conditions. There is no warranty implied or expressed regarding the usefulness, availability or the profitability of the information provided. Use or application of the information supplied is solely at your own risk. It is highly recommended that you consult with a professional investment adviser for trading advice and methodology. A good indicator is just one part of a successful trading program. Feel free to share or resteem, but please don't copy the graphics for reuse without permission.
Consider this as the “weather report” for your favorite cryptocurrency.


Looks Very interesting. I’m intrigued to see how well your model can forecast.
Resteemed
One unique feature of this indicator system - future pricing data only affects the indicator values going forward - not backwards. This means the previously published indicator values will not change. This allows you to look backward at each forecast indicator and see how it has performed in the past. You know the cliche saying that "past performance does not guarantee future results", but at least we can get an idea as to how the indicator has performed in the past. Its behavior should hold going forward into the future. I love this indicator because: it is purely mathematically based - I have no emotional or subjective input.
Thank you for the follow, upvote and resteem. I believe that this custom indicator system which I have developed has value. Time will prove it one way or the other. Keep an eye on this one! Thanks again! Nate