Bitcoin Price Watch: BTC/USD About to Explode
Bitcoin Price Watch: BTC/USD About to Explode

Key Points
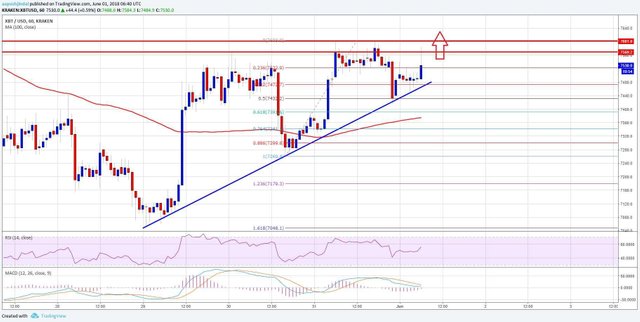
Bitcoin price is still struggling to break the $7,580 and $7,600 resistance levels against the US Dollar.
Yesterday’s highlighted important bullish trend line is in place with support at $7,450 on the hourly chart of the BTC/USD pair (data feed from Kraken).
The pair is about to make the next move either above $7,600 or below $7,400 in the near term.
Bitcoin price is approaching a crucial break against the US Dollar. BTC/USD breakout levels are $7,600 on the upside and $7,400 on the downside.
Bitcoin Price Analysis
There were mostly ranging moves above $7,400 in bitcoin price during the past two sessions against the US Dollar. The BTC/USD pair struggled to break the $7,580 and $7,600 resistance levels. As a result, there was a minor downside reaction from the recent high of $7,602. There was a break below the 23.6% Fib retracement level of the last leg from the $7,260 low to $7,602 high.
However, the decline was limited by the $7,400 support area. More importantly, yesterday’s highlighted important bullish trend line with current support at $7,450 held declines on the hourly chart of the BTC/USD pair. Additionally, the 50% Fib retracement level of the last leg from the $7,260 low to $7,602 high protected losses below the $7,400 support. The pair is on the move again and it retested the $7,580 and $7,600 resistance levels. Both the mentioned levels are important barriers and preventing gains above $7,650.
MENU
What are you looking for?
technical analysis bitcoin
ANALYSIS
Bitcoin Price Watch: BTC/USD About to Explode
AAYUSH JINDAL | JUNE 1, 2018 | 8:00 AM
Key Points
Bitcoin price is still struggling to break the $7,580 and $7,600 resistance levels against the US Dollar.
Yesterday’s highlighted important bullish trend line is in place with support at $7,450 on the hourly chart of the BTC/USD pair (data feed from Kraken).
The pair is about to make the next move either above $7,600 or below $7,400 in the near term.
Bitcoin price is approaching a crucial break against the US Dollar. BTC/USD breakout levels are $7,600 on the upside and $7,400 on the downside.
Bitcoin Price Analysis
There were mostly ranging moves above $7,400 in bitcoin price during the past two sessions against the US Dollar. The BTC/USD pair struggled to break the $7,580 and $7,600 resistance levels. As a result, there was a minor downside reaction from the recent high of $7,602. There was a break below the 23.6% Fib retracement level of the last leg from the $7,260 low to $7,602 high.
However, the decline was limited by the $7,400 support area. More importantly, yesterday’s highlighted important bullish trend line with current support at $7,450 held declines on the hourly chart of the BTC/USD pair. Additionally, the 50% Fib retracement level of the last leg from the $7,260 low to $7,602 high protected losses below the $7,400 support. The pair is on the move again and it retested the $7,580 and $7,600 resistance levels. Both the mentioned levels are important barriers and preventing gains above $7,650.
Bitcoin Price Analysis BTC USD
Looking at the chart, the price seems to be approaching a crucial break either above $7,600 or below $7,400. On the upside, a break and close above $7,600 could set the pace for a push towards $7,800 and $8,000. On the flip side, a break below $7,400 may perhaps take the price to $7,260.
Looking at the technical indicators:
Hourly MACD – The MACD for BTC/USD is about to move back in the bullish zone.
Hourly RSI (Relative Strength Index) – The RSI is heading higher towards the 60 level.
Major Support Level – $7,400
Major Resistance Level – $7,600
Tags: Bitcoin Analysis, bitcoin price, Bitcoin price analysis, Bitcoin price chart, bitcoin technical analysis, btc, btcusd
By
AAYUSH JINDAL | JUNE 1, 2018 | 8:00 AM
Great article! There are huge levels of uncertainty within the market, alongside low levels of volume, it is continuing to force the price of Bitcoin lower. A healthy trend will always have areas where it pulls back, normally around the major zones of support/resistance and this exactly what price is developing right now. A downtrend has formed creating lower highs and lower lows which has forced investors/traders to short the market and send price lower. I believe price will continue to rise to roughly the $8,000 area before we see this downtrend continue.