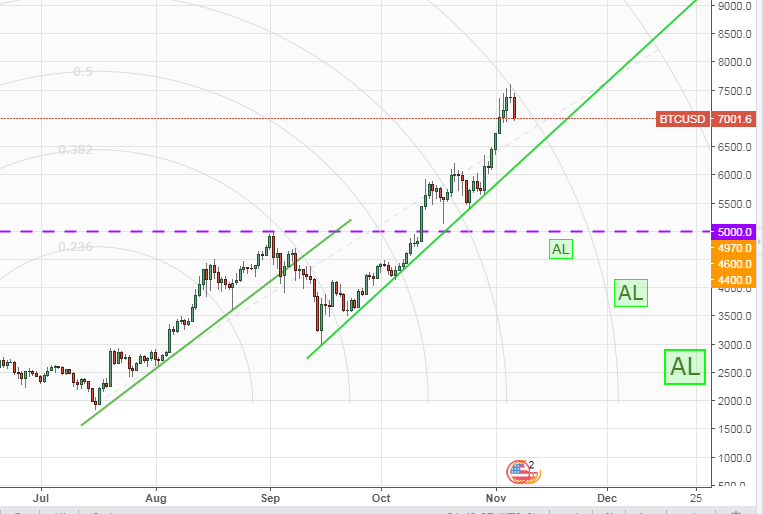
If the decline starts in Bitcoin, what levels can support it?
As it is known; "Probability", what they can be, "Statistics", is about what happened.
Looking at the past of price movements,
If χ has been happened more often than A B C conditions ⇒
again the χ can occur when the conditions of A B C occur again.
this is called Technical Analysis.
We'll try to analyze the Fall Scenario for the Segwit2x contest or some other reason to post bad news in the near future. [update: S2x has been canceled but this post may still be useful]
First Green Support
Let's look at the first green line on the left. During the ascension movement, during the fluctuations, the price went up when the line was touched. From the first week of September / September, Support is broken down.
In this case, the price has fallen from 5000 to 3000.
Second Green Support
The second green support line on the right supports 7-8 times to go up. If for some reason Bitcoin breaks this support downwards ⇒ it is expected to fall to the previous peak levels as before.
Visual: @murattatar, tradingview.com
When we look at the previous summit, it can be said that the possible targets are $ 6,200 and $ 5,000. If a much tougher event occurs, this time it will head for the previous peak of $ 3,000.
This is NOT investment advice.
Original Turkish post here

Eline sağlık kardeşim. 10 numara olmuş, yazı.
Eyvallah ;)
Today, when I was at Starbucks, two people were talking about the Bitcoin. I felt so lucky because I know what is it, of course I should learn the details of it.
One of the nice things about living in the future