Bitcoin (BTC/USD Coinbase)—Bullish Channel or Bullish Triangle? What'dya think?
The downside targets are fairly clear, but bullish case should it keep going, what's the deal?
...tapping into my inner Seinfeld...
Well I'll tell you fellow pile-of-Steemer

My take is that we seem to be trying to decide between a channel or a triangle. The triangle isn't "perfect" it has blow off tops / fake breakout written all over it, which bitcoin has a lot of that you wouldn't necessarily expect. But it's there, and you can look to the previous breakout around 5700 for the exact same pattern.
BTC/ USD—4hr
EMAs 8, 23, 38, 62, 100 (thick orange), 138, 162, 200 (green)
VWMAs 362, 538, 786 (light blues to purple):
https://www.tradingview.com/x/ThoZlyTe/
- Was holding the triangle pretty well the last couple tests of the 200 EMA.
- Just recently in the last push up, it seems to be trying to get back into the channel.
- Descending light blue dash line from the top middle left of the screen down to the right, is apart of a bigger triangle.
- VWMAs are coming in at the market lows or other topping areas from earlier in the run. Suggesting if price falls those will be super important.
- RSI is leaning bearish in the short term setting lower highs, but also giving room for a good push up should price start moving upward. Cools off the bears the longer this pattern holds, channel or triangle.
- whichever way this plays out has a big outcome for short term price movements, if we hold the channel we'll see the upper resistance of the triangle dissipate but the breakout will probably be relatively subdued, potentially still have a new high in it. Holding the triangle is a little less bullish in my opinion and would be more neutral to bearish because this already looks like a topping area and would suggest to many that a head and shoulders reversal would be underway.
- Even the slightest break of the 200 EMA is immediate drop to the next VWMA or fib line or both.
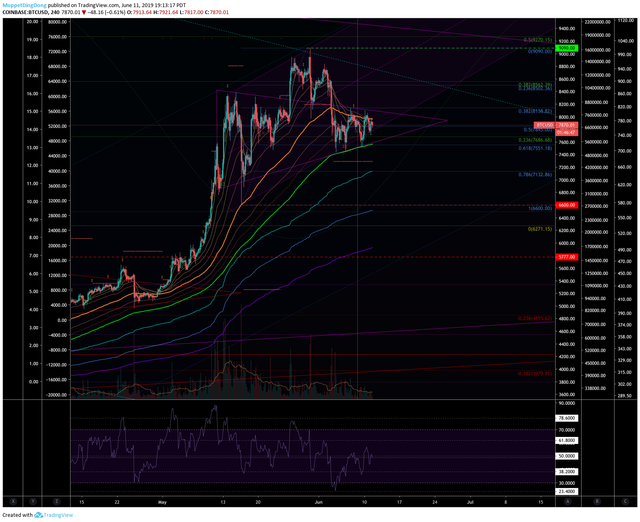
And the same thing on the daily
The light blue / purple channel is the linear regression ±2 Standard deviations of the current run up and the middle is the true calculated average line of best fit. I wouldn't expect price to get too wildly outside of the bounds of this regression right now. Perhaps if shit really hits the fan, or the pump goes wild, but those would either be buy or sell signals. If we do dip, daily 200 EMA is the likely buy target. Buy low, sell high :D
https://www.tradingview.com/x/Nz18x8TG/
.png)
What do you think?
Leave a comment if you found any value plz plz.
👇👇👇
*Just a random dude on the internet sharing his thoughts. Do your own research, I'm not a financial advisor or licensed in any way. I hodl bitcoin and I'm generally bullish long term but not to the point of stupidity, so take that and my thoughts as you will.
**Leave a comment, say hi, say thanks, tell me I suck. Upvote, something, shit. Is this place just bots? Or do we have real people. If you've made it this far, do something that shows you're a person roun' here. Thanks, partner.
***Some free crypto on coinbase earn if you need the invite link because coinbase hasn't sent you the emailz: https://coinbase.com/earn/xlm/invite/3jc4hnm1