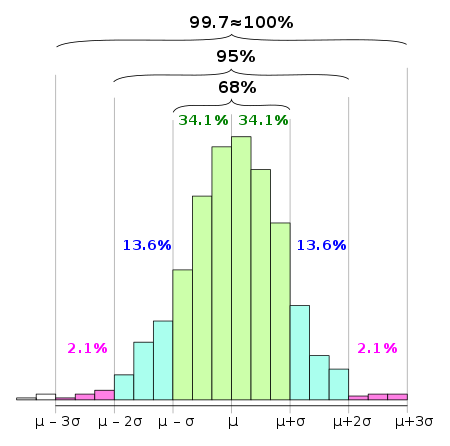
Bitcoin Breakdown Looking Suddenly More Likely. May The Odds Be Ever In Your Favor.
Bitcoin Just Finished Topping at ~$7450
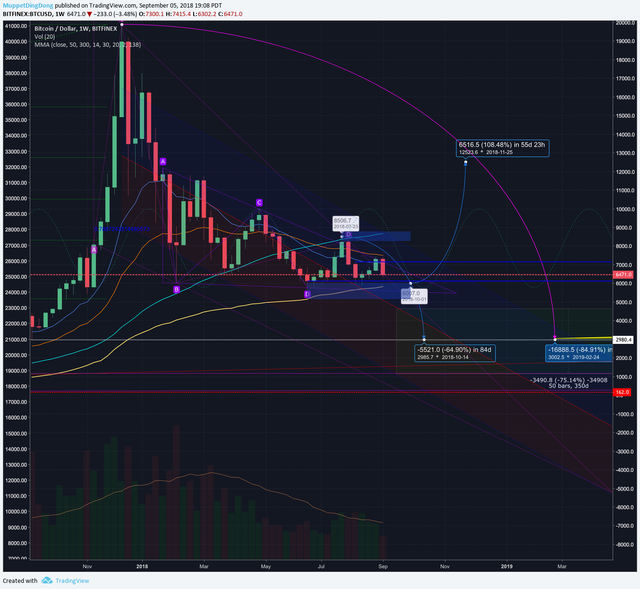
The must hold line now becomes our low formally $5750, but because if we want to consider our general bullish market thesis here:
~$6250 is a higher low in a turn around of the weekly equilibrium / consolidation pattern and is now a must hold otherwise it will be back to Hodl-onto-your-butts territory. The 138 VWMA (yellow line) is our critical breakdown line and it is awful close and nearing the active trading zone, and headed directly for the hinge point at ~$6000 coming up where we will likely know either way.
I've marginally adjusted or accidentally moved my lines, but they are virtually unmoved for months. The next 2-4 weeks (or so) which have a probably large move attached, look to be approaching imminently where we will know one way or another simply "Up or Down." The move won't be slow, so be prepared to move quickly, whatever you're financial decisions are. My dates are just estimates but have been hitting pretty close so far this year.
https://www.tradingview.com/x/oWdMSlBK/

- We've slightly broken out of our large purple triangle but are crashing back into it currently.
- The trading range is becoming extremely tight comparatively
- The undulating cycles of price through the equilibrium have become tighter (the sine wave)
https://www.tradingview.com/x/MSiX2aiN/
.png)
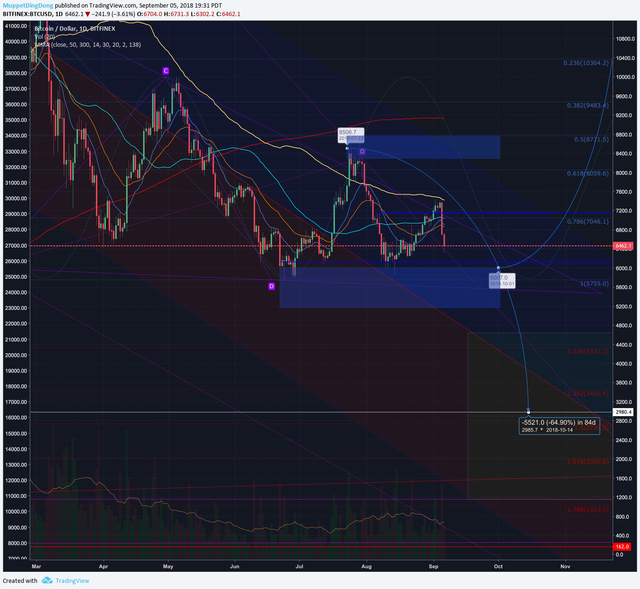
- It looks like a giant bull flag, long term at least that's good. Suggests a huge move ... laaaater?
- The 2 Standard Deviation Linear Regression calculation of this whole crash is really likely to act as an anchor to our bullish thesis; breaking out of this would mean there is a very strong probability this bearish wave will be done and will have signaled a move outside 95% of the sampled price data, meaning that's a powerful signal. At soonest that is probably around November, so if we don't collapse here in september...
A bit tighter look:
https://www.tradingview.com/x/I1nQ1Kai/
.png)
- Blue Boxes represent the serious support and resistance zones; where the real battles are going on and where traders are dominating the action.
This is why we care about Standard Deviations
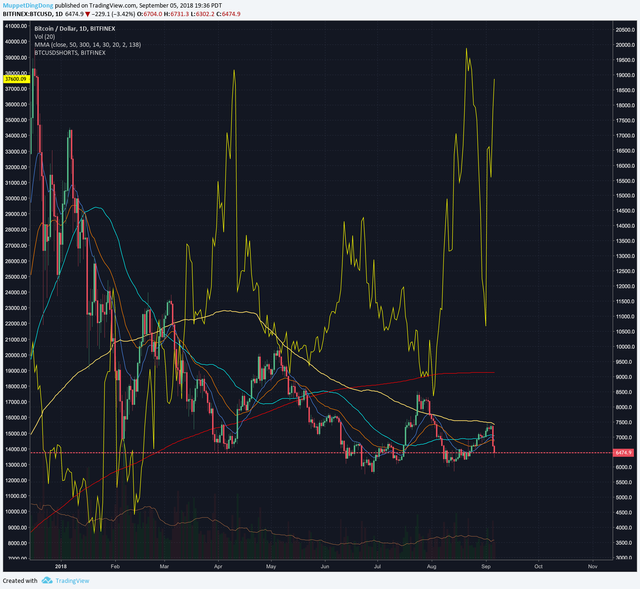
Shorts are Climbing again. Alot.
https://www.tradingview.com/x/vfS7fpwJ/
.png)
- In the event of a short squeeze, this will help kickstart the bullish case, or depending on your view, slow down the capitulation
- In the event of the shorts being correct, this will cause problems imminently, and for a while. We would at that point really need go for the bottom until these spiral absolutely out of control and moving averages recover from the fast approaching crash.
- Some would say this is already way out line with what they might expect.
- That's a lot of leverage.
On the weekly closing basis (we are intra-week), this looks bearish if you assume shorts here are "smart money"...debatable.
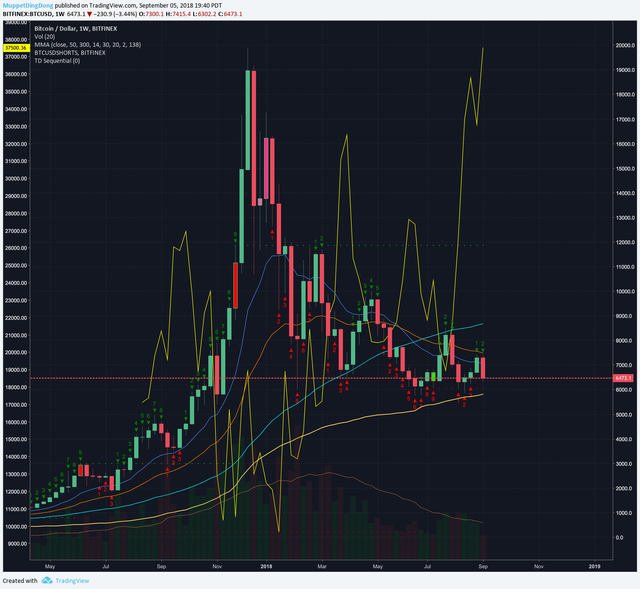.png)
- Overall I'd say this looks bad. Hurts anyway.
- The more times a support / resistance line gets hit, the WEAKER it becomes, so that ~$5800-6000 level if hit again may not hold, that would be the 4th major support test while we keep hitting lower highs.
May the odds be ever in your favor
This is not professional advice just a random guy on the internet sharing his thoughts.
