IS STEEM READY TO TAKE OFF? OR IS IT ABOUT TO DIP AGAIN?
IS STEEM READY TO TAKE OFF?
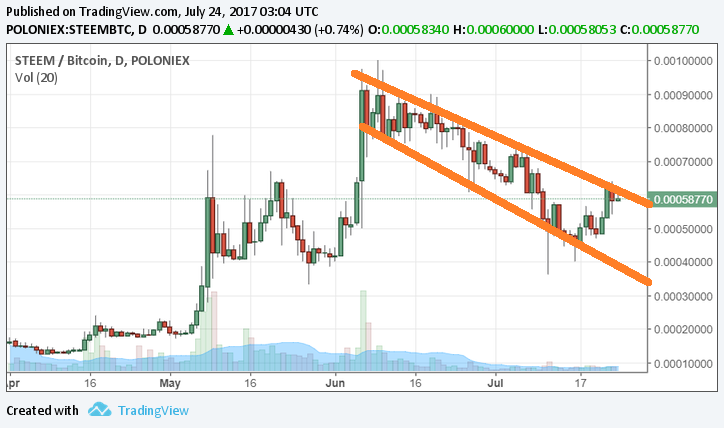
As you can see in my chart below, STEEM has been playing inside a bullish flag. Bullish flags usually break to the upside because they are an indication of consolidation. You have strong buying followed by weak selling. But usually when they break out, they dip quickly and retest the flag from the other side before continuing up and that's when most traders will get int. At this price however, most intelligent traders sell and wait to see what happens which is why the price is struggling again. If the price dips again, it's going to retest the previous lows just above 0.0003 BTC. My personal bias is downward so I'm expecting another dip!

MR. OPINIONATED!
Please be advised that trading cryptocurrencies comes with a high risk and any opinions, research or other information contained in my posts is provided as a general market commentary and opinion only, and does not in any shape or form constitute investment advice. I will not accept liability for any loss or damage including, without limitation, to any loss of profit which may arise directly or indirectly from use of or reliance on such information.
WHAT SAY YOU?
If you like this post, please consider giving it an upvote and/or a resteem as that will encourage me to post and share more stuff like this. Also, please don't forget to let me know what you think below. I won't be able to reply to every single comment, but I promise that I will read them all!
Don't forget to UPVOTE, COMMENT, and/or RESTEEM!
FOLLOW ME ⇿ @msg768

UPVOTE, COMMENT, and/or RESTEEM!
FOLLOW ME ⇿ @msg768

Lets see what happens
They say time will tell! Thanks for your upvote :]
I hope it dips while BTC is high. I might buy with my small BTC reserve.
If it dips, everything will probably dip with it. The only thing that may not dip or may actually go up is SBD which is pegged to the US dollar. Why don't you exchange your BTC for USDT or SBD and wait to buy STEEM when it dips? I'm personally bearish on BTC as well. Wrote a post about it the other day. I think it's a double top and it's going to dip sooner or later. Have a look at my charts HERE.
I know major cryptos tend to track together. I have a decent SBD reserve already though.
Fair enough. I have about 800 SBD. I've already placed my order but I might change my order later because I've placed it at an extremely cheap price! LOL :]]]
What are good indicators of price movement besides the flags?
Thanks for the comment and upvote! I appreciate your support. The best indicators from my experience are price actions themselves. Bullish and/or bearish flags are short-term trend lines/channels basically. You may wanna consider the long-term and medium-term trend lines/channels as well as supports and resistances which are previous highs and lows! I use a thick line to ignore/skip the noises and I also tend to ignore/skip the highs and lows but instead tend to look at open and close prices to get a more accurate understanding of the market. :]
I think as with all markets, steem will go through ups and downs in order to break into a new high so yes, I agree with you that it will dip again. The question is when not if.
I thought my post is clear about when! My chart alone is clear. Isn't it?
Hey msg,
I like that you said this. I just posted my own STEEM/BTC analysis and actually asked whether it was just a big flag pattern.
Interesting that you see the pair dropping further, but it can still drop all the way back down to the bullish upsloping trend line support and still be in an overall bullish trend.
I still like the opportunity of buying here for a bounce off the intraday levels I've identified though.
I saw your charts. You're using thin lines and you're not ignoring/skipping the highs and lows which are usually nothing more than just extra noise! I have learned to use thick lines and ignore/skip the highs and lows to get a more accurate understanding of what's going on. It's all speculation at the end of the day. Only time can tell which chart is more accurate! Good luck :]
I agree with you. Even though the lines may be thin, I mostly treat them as 'zones' rather than hard lines.
Support/resistance is never black and white.
Turns out I was right. At least as far as today and yesterday is concerned :]
Yep, Steem getting pumped.
Good post Marcus
Thanks heaps mate. I appreciate it :]
Congratulations @msg768! You have completed some achievement on Steemit and have been rewarded with new badge(s) :
Click on any badge to view your own Board of Honor on SteemitBoard.
For more information about SteemitBoard, click here
If you no longer want to receive notifications, reply to this comment with the word
STOPnice post please upvote me and follow me
This post has been ranked within the top 10 most undervalued posts in the first half of Jul 24. We estimate that this post is undervalued by $45.03 as compared to a scenario in which every voter had an equal say.
See the full rankings and details in The Daily Tribune: Jul 24 - Part I. You can also read about some of our methodology, data analysis and technical details in our initial post.
If you are the author and would prefer not to receive these comments, simply reply "Stop" to this comment.