Bitcoin - Technical Analysis, Rationale and Trade Plan
Hi. I am here to post an interesting Technical observation on Bitcoin. And no, it probably wont go down to $4000 any time soon.
This post gives you the idea of going long on BTC, the rationale and obviously a trade plan (actually two of them)
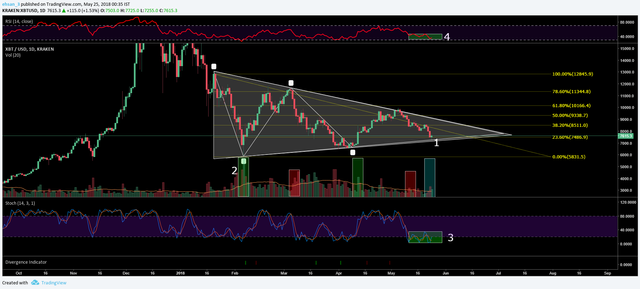
Here goes the first chart: ![simple.png]
Observation:
First thing first, we have a clear case of higher lows, i.e 5800, 6300 and now hopefully 7200 (subject to day close). With that comes the tricky part, lower highs which make it a perfect symmetrical triangle formation on the daily chart. The idea with triangles is that the price has a 53% probability of breaking upside, giving the downside a fair share. Let me further share a few characteristics of a triangle formation:
Price trend:
Can be any direction leading to the chart pattern. (Okay this is a generic one)
Shape:
Triangular. Prices move between two converging trendlines. (happening in this case)
Crossing:
Price must cross the pattern from side to side, filling the triangle with price movement, not white space. (yup, we have this too)
Touches:
Price must touch each trendline at least twice, forming distinct valleys and peaks. (Done deal)
Volume:
Trends downward 86% of the time. (Trending down in this case)
Breakout:
Upward 54% of the time and 75% of the way to the triangle apex (upward breakout) and 73% of the way for downward breakouts. (Probability of what could happen in the near future)
Further, this is how a completely formed triangle looks post breakout:
What happens next?
After testing 7200 today, I am pretty sure we're going towards the upper edge of the triangle (Which is considerably a small target and definitely not trade worthy. Though, there are high potential alts that can amplify this move).
Observations:
- Today's test of the lower end of the triangle was seen as a great buying opportunity by the Bulls. Hence, this is why we have a nice pin bar with decent volumes (2).
- Volumes on the lower tests are generally higher than those at the upper tests that result in negative reversal. This goes to show your classic accumulation pattern with buying interest at attractive price points.
3/4. Indicators such as RSI and Stochastic are in a fairly oversold state pointing towards a reversal.
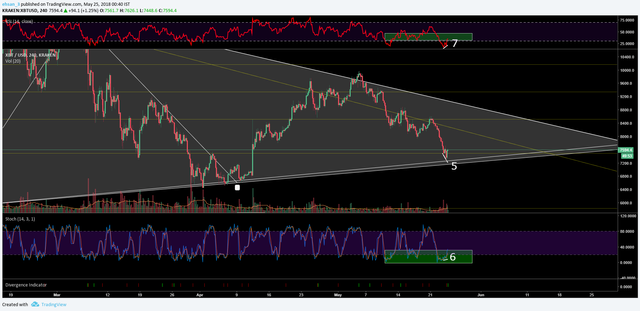
Observations:
5/6/7: Clear positive divergence. RSI and Stochastic point upwards setting stage for a possible reversal in price. Divergence in indicators and price spots reversals with an accuracy of over 80%.
We are going for another upside test anywhere between $8600 to $8900 subject to where the upper side is tested. (hopefully leading to breakout)
Plan your trade, trade your plan:
There are two trade plans to get in on the rally:
Plan # 1:
a. You go long between $7700-$7300 with a strict stop at $6300. Place a sell for 25% of your holdings between 8600-8900 (subject to where the upper side of the triangle is tested).
b. Keep the rest for $13000 (a slightly conservative post-breakout target)
A plethora of moving averages (not writing down the values as they change) will give it a hard time to reach the upper end of the triangle:
-9 days moving average
-50 days moving average
-21 days moving average
-100 days moving average
-200 days moving average after we breakout from the triangleStiff horizontal resistances at $8500 and $9300.
Plan # 2 (How a professional trader would go about it):
A professional trader would want to wait for the actual breakout. Hence, treating a day close above $9300 as breakout, you may go long for an initial target $11600 (sell 30%), and finally $13000 where you sell the remaining volume. The important part here is the stop out zone. Retesting the upper edge of the triangle is a possibility immediately after the breakout. Hence, we treat a day close below the upper end of the triangle as the stop zone. Another stop could be below the horizontal resistance (turned support at that point) at $9300.
Hinderance:
- 200 days moving average - strong resistance but likely to break considering the formation
- Horizontal resistance at $11600, where we plan to book partial gains
The second plan gets you rid of the jumbled up plethora of moving averages with higher chances of a successful trade.
Happy trading! :)


✅ @moneyman666, I gave you an upvote on your first post! Please give me a follow and I will give you a follow in return!
Please also take a moment to read this post regarding bad behavior on Steemit.
Congratulations @moneyman666! You received a personal award!
You can view your badges on your Steem Board and compare to others on the Steem Ranking
Vote for @Steemitboard as a witness to get one more award and increased upvotes!