Bitcoin in-depth analysis - price/market breakdown (W-D-4H)
Week chart
Important points discussed are 0), 1), 2) and 3)
Zoom in to fully observe the charts!
Let’s zoom out to the week chart to check if we can find some patterns.

0) the resistance range caused resistance round 11234 - 11934 at that range.
1) The darker blue dotted line shows Resistance @ 9615 level, corresponding with an old bar of the week chart, shown by the dark blue arrows. For the top (on may 5 and 6) we have to look at the day chart to refer the levels.
2) The light blue dotted line is one bar below the previous bar on the week chart. The ma50 line also offered some resistance in July (yellow circle).
3) At this point it looks like we are following the pattern of the week chart, check the red dotted line, again one bar below previous high. It’s still not sure if we’re breaking this pattern or not, still a lot can happen. But keep in mind, if we’re following this pattern, and we will go down to 5800-6000 again (or even below) the next bar on the week chart is the 5800-6000 range (Bottom line). So we’re squeezing around this level. I also draw some lower bottom lines in case we break the 5800. It’s seen in the black box on the left corner. Also check out the EMA cross, this is an EMA20/40 Cross, which is a strong overall bearish sign.
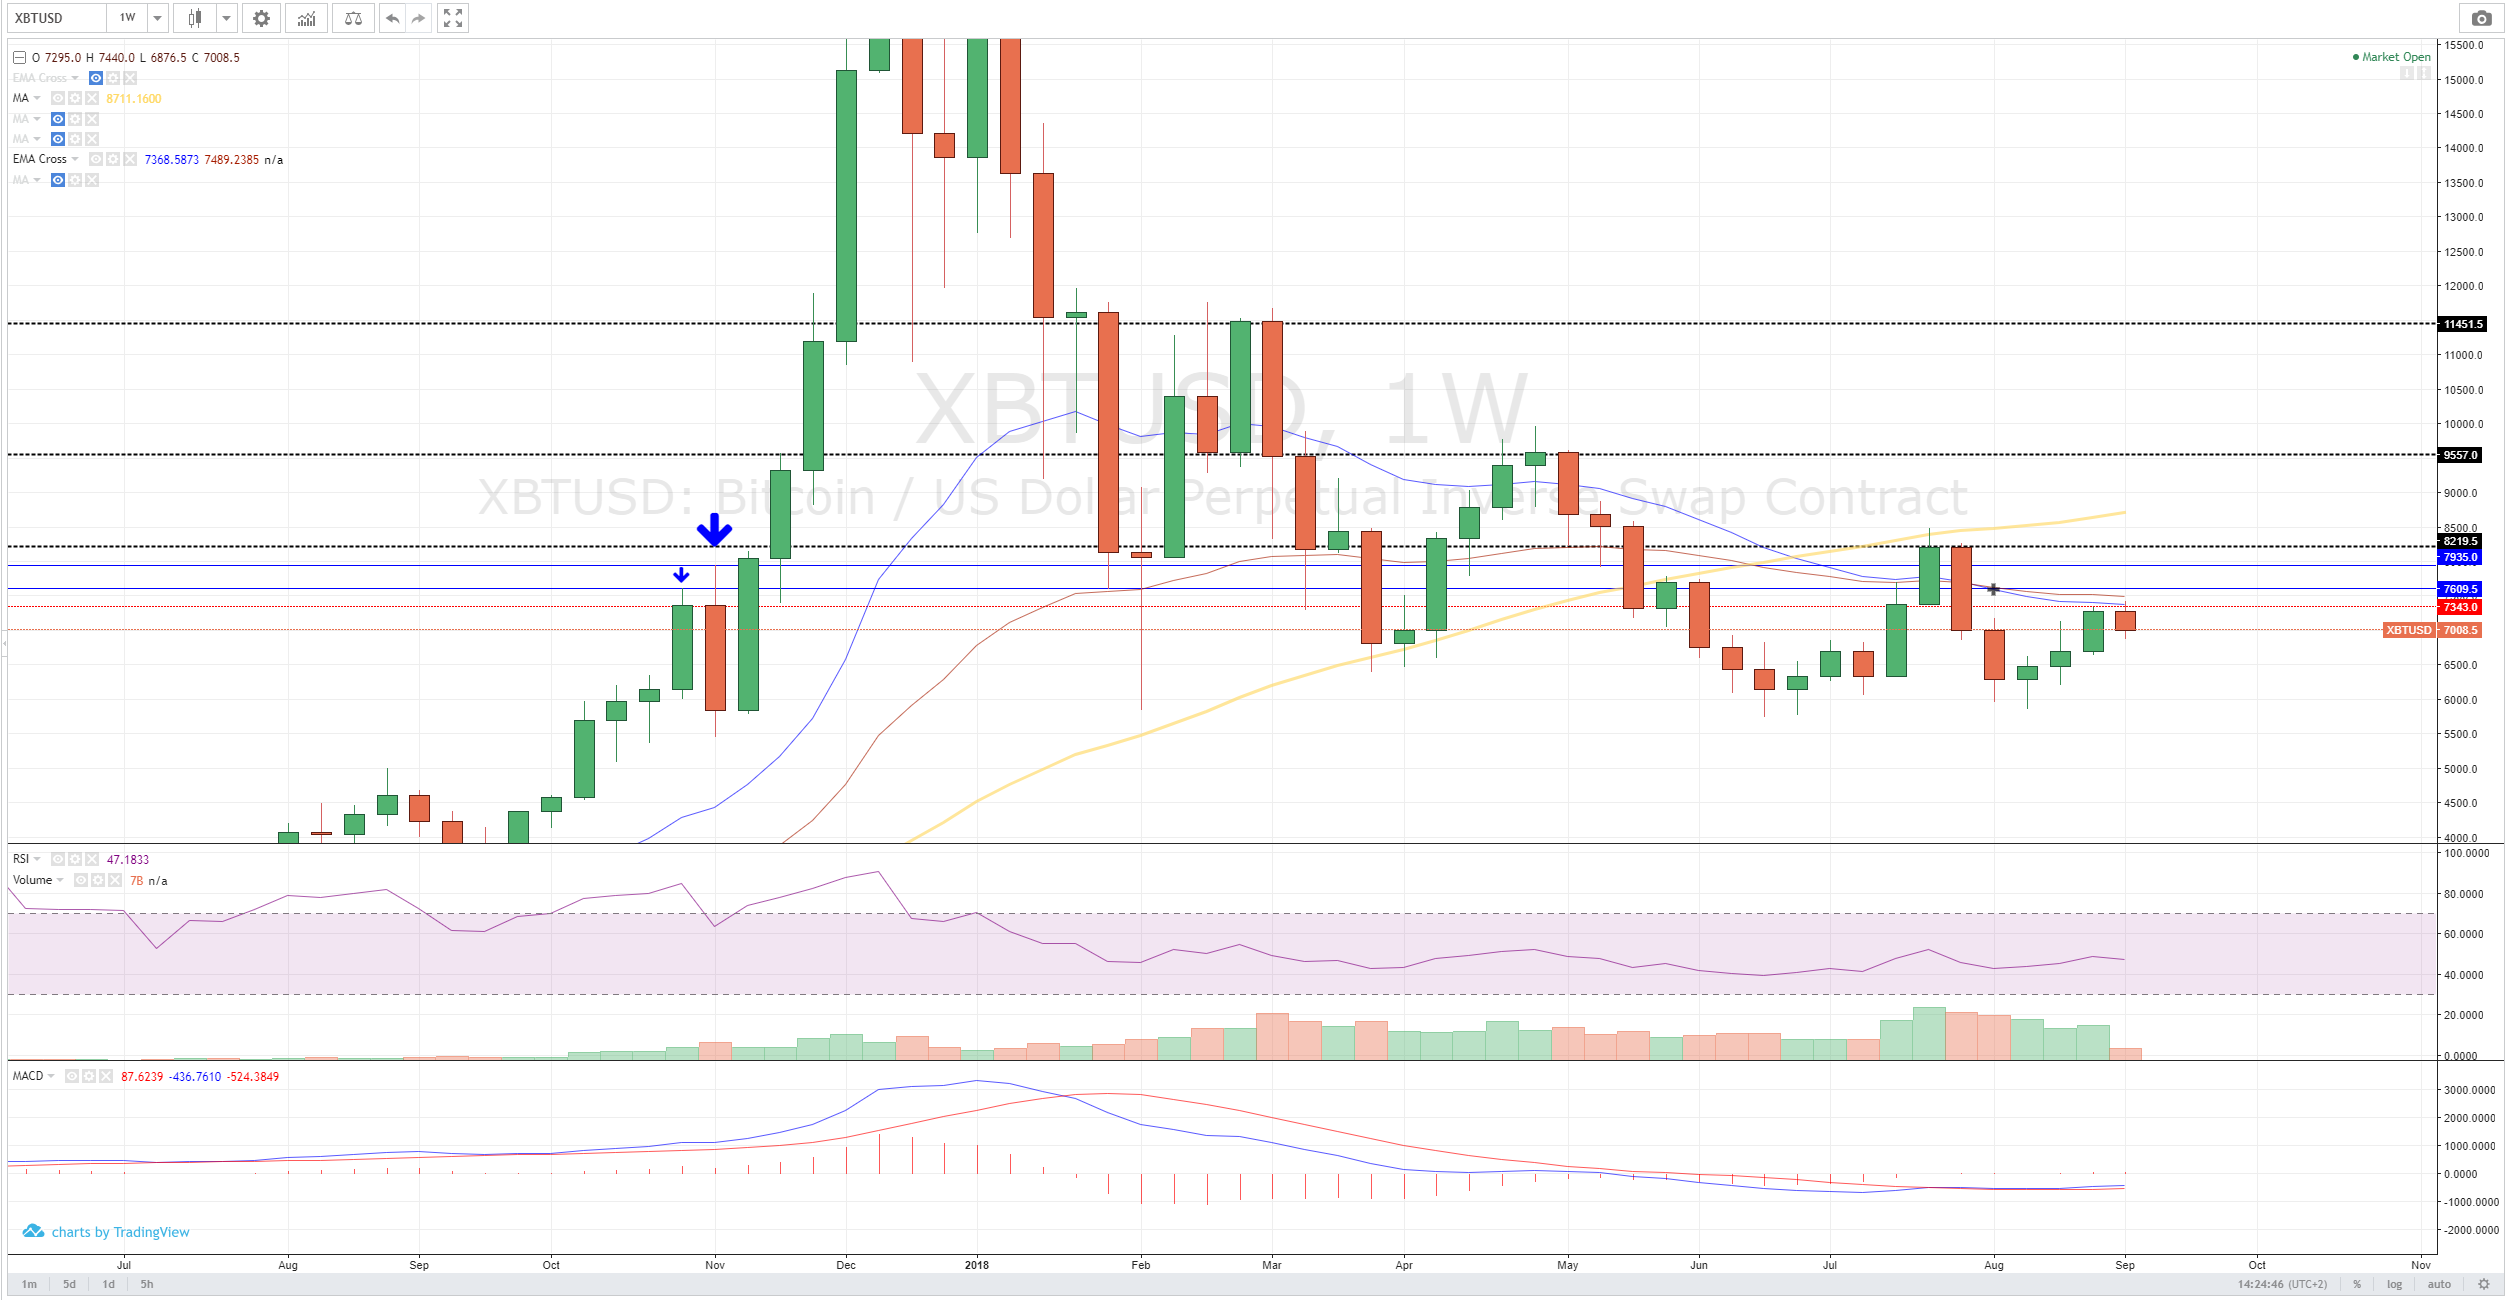
I also have to mention that these bars on the week chart have some tops which may not be overseen. These tops are around 7935 and 7609. We can optionally expect a bounce back to these levels. Some old resistance levels were 7050 and 6750. We will discuss these levels in the day chart analysis.
Day chart
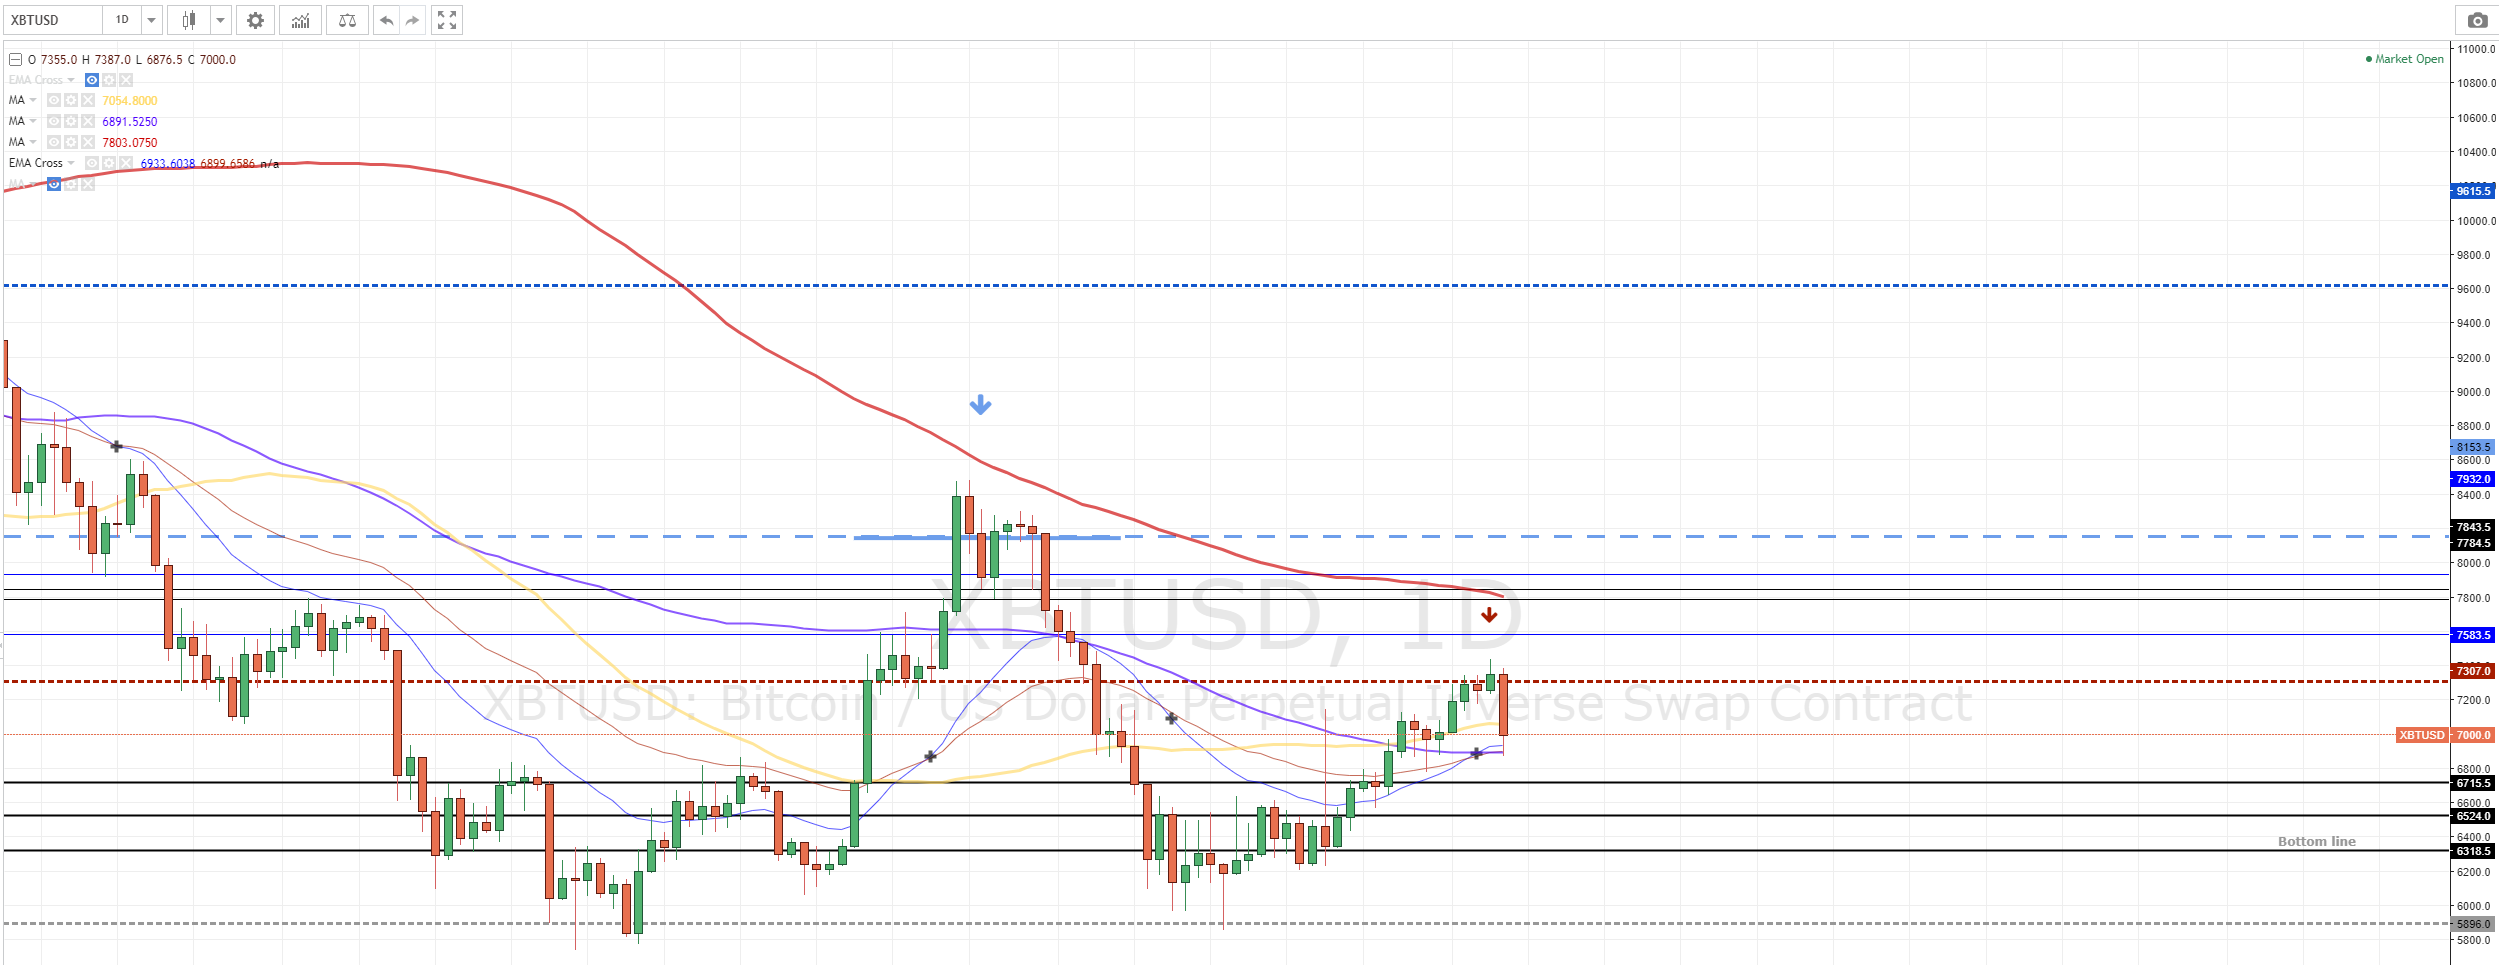
Line for the day chart analysis are all made black. Small blue lines @7583 & 7932 are from the tops of the week candles (seen is previous chart). For the day chart there are quite some support levels. The Most important one for now is the 6750 level, it took around 3 days before we breached that level. There should be some buy orders around that level.
Also at 6715 took quite a while before breaching. In the charts we see a range of candles between 6715 and 6242. For now the ema lines show some support. But there is a good change going down to 6750.
Because of the sell strength we can expect some recovery because the RSI needs to correct. Which could result in a double top. Maybe around the 7300 level, maybe even above (blue lines). If we don’t fall below 6715-6600, I’am expecting a double top behavior pattern. Also because the ema cross shows bullish signs. And the ma100 > ma200 on the 4u chart.
4u chart
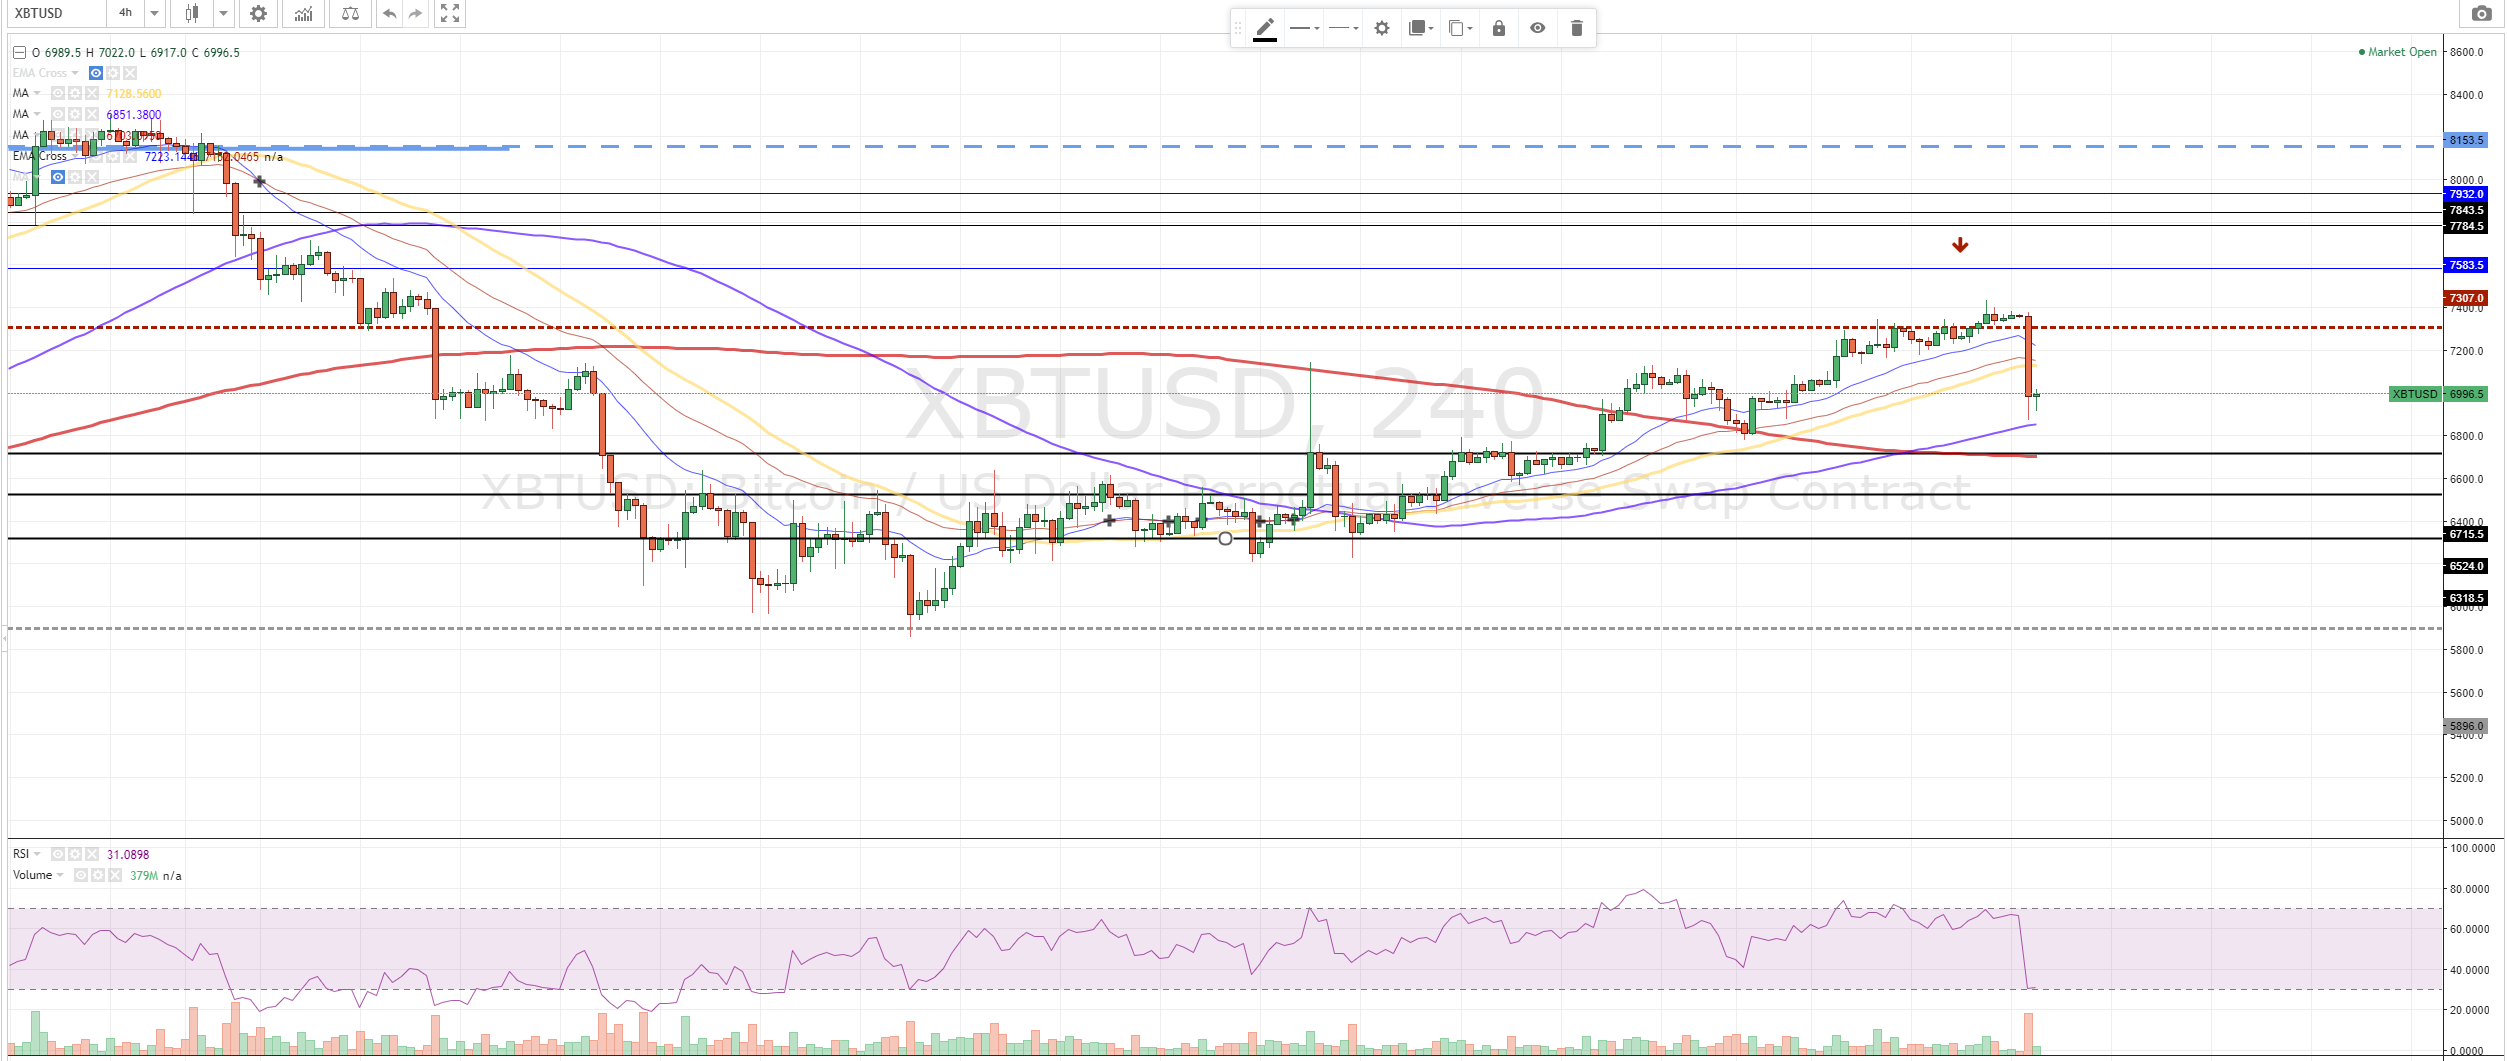
The 4u chart shows us a huge instant sell off. Previous support levels can still be seen, these are all the black lines. Here is also seen that the ma100(blue)>ma200(red) which usually results in a temporary bullish trend. Also the RSI is at 30. Which should recover. If it reached 40, it will start a small bull trend. All these signals combined causes my prediction of a double top pattern.
Conclusion
We’ve seen a huge dropdown today. Patterns go way back, seen on the week chart.
I’ve also found some hints for a double top pattern, there are still bullish signs. But a drop this huge always comes unpredicted. Be carefull around 6750 and 6715 levels, this is potentially a good buy spot. But be careful if the market goes up. The Week charts still shows me that we are inside a bear market. So a double top pattern is likely to come. Also the next resistance levels, regarding to the weekchart. Will be around $6.000, we’ll have to see what will happen afterwards. Maybe we break through the crucial bottom line @ $5.800. (levels beneath or shown) Maybe we’ll see some consolidation.
TA is no guarantee.