[Bitcoin] - TECHNICAL ANALYSIS WITH RELEASE STRENGTH INDEX
TECHNICAL ANALYSIS WITH RELEASE STRENGTH INDEX
- What is RSI?
The RSI is an oscillator of price and oscillates between 0 and 100. The RSI represents the average of the number of days that a gain is relative to the average of the days of a decline in a given period. . The RSI was built by Wilder, he recommends 14 days RSI. After a period of use, the RSI is commonly used in time frames of 9 and 25 days. One of the most common methods of RSI analysis is to find a divergence at which the new maximum is reached and RSI does not exceed the previous peak. This divergence is also a sign that there is a reversal. If the RSI falls below the previous lows, RSI has just completed a "failure swing". Failure swing confirms a new impending reversal. - APPLICATIONS OF RSI
2.1. Basic application:
- RSI <30 indicates overbought
- RSI = 50 - 70: showing overbought
- RSI> 70: variable
- RSI is a sign that the trend is reversing when the indicator is overbought (rsi <= 30) / overbought (> 70).
- The 50 line in the middle, is a sign that the coin market is about to rise or fall. If the RSI rises above this line, it is a sign that the price of the bullion is expected to increase (Bullish). Conversely, if the RSI falls below this line, it is a sign of the price of the coin that is expected to fall (Bearish).
- The most basic use is RSI which crosses above 70 and cut down, then RSI goes up to 30 and cut back to buy. Or another use is the price cut to the 50 area is the upward trend, cut to the 50 is bearish
- RSI is a very good tool to rely on which you can confirm trading signals of any simple or complex trading system. It gives an early sign of reversal before a trend reversal. However, the downside is the need to observe the track, there are still error signals. RSI is not effective when the market tends to be strong. Therefore, we need to combine other tools such as BB, MACD, Stoch ...
2.2. Advanced application of RSI: - Trend signal is likely to reverse when the indicator and price divergence.
- Determine the trendline in RSI. Broken trendline up down and break trendline down up.
2.2.1. RSI diverts to detect reversal signals
a. Regular Divergence
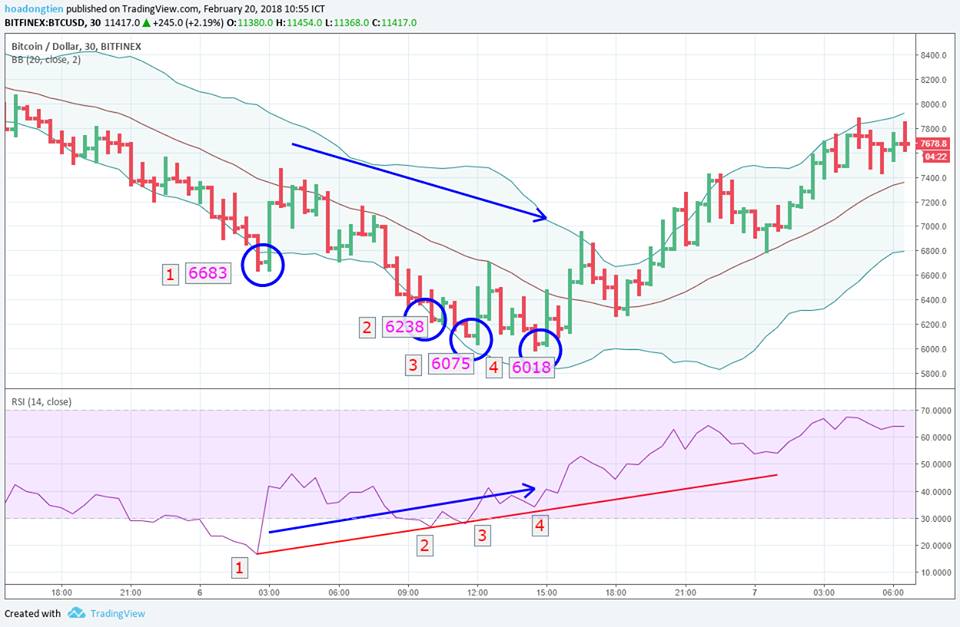
Divergence is one of the very useful knowledge of technical analysis. This is a new high, but RSI is low, or low, but RSI is high. It is a "phase shift" between price and indicator (indicator), can warn that the strength of the price has weakened and can warn the reversal. This method is used to find the trend reversal. - Case 1: The continuous price trend created new bottoms lower than the old bottom but the RSI continuously created a new bottom higher than the old one. It is worth to buy. My strategy at this time like this is, divide the capital at the bottom of point 2, point 3 and point 4 ...
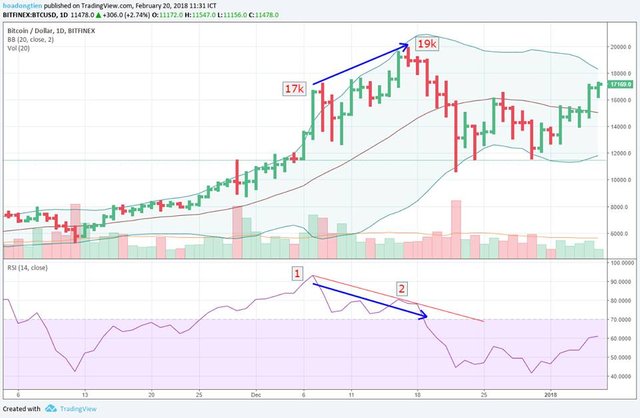
Why RSI is forming a higher bottom (ie, the uptrend) but the bottom is still lower? RSI has shown that the selling force is weakening, the buying power is increasing, but the buying power is not strong enough to win the selling power, so the result is that the price is not clear and the price is still lower. . It is the phase difference that is the nature of the usual divergence. Because we are buying what is going to increase, we know that when the buyer wins the sale, we will have a profit. - Case 2: The continuous price chart created a new high above the old peak, but the RSI is continuously creating a new peak below the old peak. It signals the trend reversal is imminent. The RSI divergence forecast is hard to come by as the RSI is declining. In this case we should sell.
Why RSI is creating a lower peak that can still be higher?
RSI is a lower peak, meaning that the demand is decreasing, selling pressure is increasing. However, the selling force is not strong enough to win completely, so the price still goes up one more time. We then sell what we know to be very high that it is about to fall.
b. Hidden Divergence
A divergence is a divergence that not only indicates a reversal of a trend, but also indicates the possibility of a trend reversal. This divergence is slightly different from the usual divergence. At this point, the price created a low but RSI created a high, or a high bottom, but RSI bottom created low. This is the method that trend traders use to find the next point in a trend
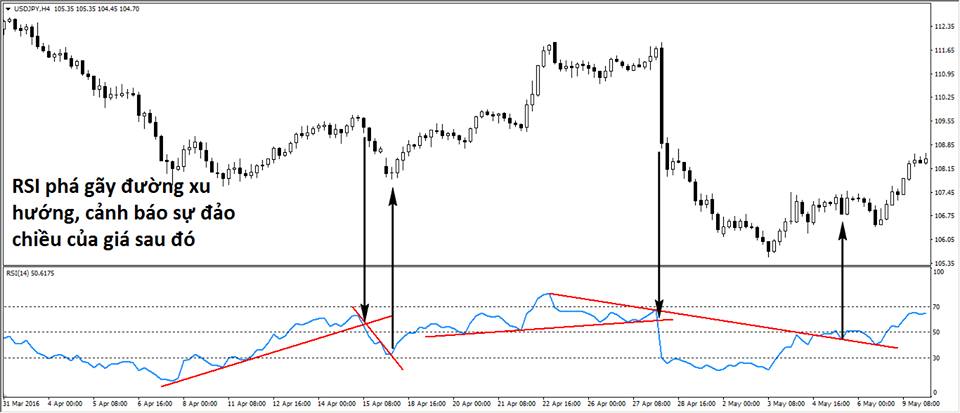
2.2.2. Draw a trend line for RSI
This is also the way some "high players" used to predict the early reversal point. If the RSI breaks its trend line - it could be a sign that prices are down, carefully reversing.
2.2.3. Modeling for RSI
This is also used by many traders. Patterns are often drawn as Wedge - wedge or 2 peaks, 2 troughs .... The reversal is forecasted to occur when the price breaks the pattern.
2.2.4. Identify new trend with area 45-55
The area between 45 and 55 is called a trendless region. Only when prices escape this area a new trend is created. If cutting down 45 is a downward trend, cutting to 55 is bullish
- Things to keep in mind with just the RSI
- The candle has not been in a hurry yet. This happens when you see that the RSI has moved up / down the trend but the candle has not closed yet, then you need to watch Vol (and some other indicators) If it is strong enough, then come to the conclusion to divide the capital into orders.
- Accept orders / interruptions: When the trend line, you should enlarge the RSI on the tradingview and try to be as accurate as possible, but remember the absolute not in this market. Sometimes you also need to accept a low level of command / noise.
- Always ensure the principle of capital management and cutting losses
- The combination of other indicators / indicators such as MACD, Fibonacci, stochastic, BB, SMA, Volume ... the combination of many analysis, will help you get more accurate signals.
- In the surf is always interested in the market trend and BTC
- Always compare the different charters of the day to get an overview
- Absolutely no hands in the order, just play the right amount to experience because there are some cases sharks can cause technical break
- Always follow the principle of controlling greed.
- Only when you have seen the signal clearly, not feeling.
For future viewers: price of bitcoin at the moment of posting is 8317.10USD