BITCOIN (XBT/USD Bitmex) - Price Action Analisys and BUYING Strategy explained

The current situation on Bitcoin, in the short term (intra-day), shows bearish directionality, with clearly predominant aggressiveness in sales.
In fact, the selloff candles are long and accompanied by significantly larger volumes.
Purchase transactions, on the other hand, consist of small candles and few volumes.
Personally, I stopped working during this period based on intra-day price action, as most of the time it gave false signals: Bart pattern, stop hunts, and so on and so forth.
I am operating on daily Time Frame or higher .
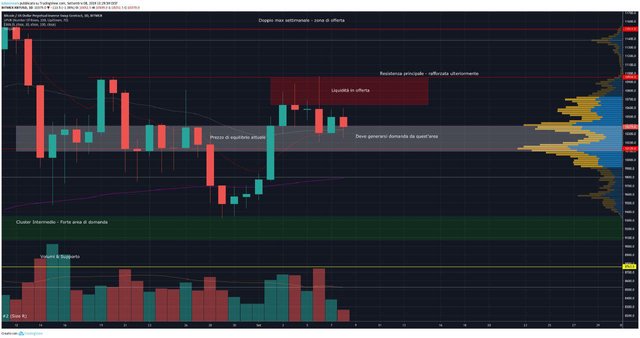
On daily time frame, the short term price direction is still BULLISH, determinated by the last dominant candle, the green one occured in the 2nd of September.
To maintain it, the gray area that currently serves as a price attractor, must become a demand area, and reject the sellers' assaults to make the Bulls more likely to seek LONG positions, pushing up the price.
As long as this does not happen, we remain congested in this situation.
If, on the other hand, we lose the gray area downwards, we risk another attack on the lows, and if the violence in sell orders remains high, the risk of losing them is high, given that we would also arrive from a lower high.
CONCLUSION: at the moment, on Daily timeframe the price is in a "no trade zone", until it breaks the 11k (Bullish Bias) or the 10k (Bearish Bias) , including candle closure!