BTC Update!

Yesterdays chart I discussed some on Consensus and lack of pump and known events just should not trigger anything significant without some major positive news. So instead we are just falling this week.
I was expecting further downside yesterday and was targeting a level of $7800-8200 which a few hours after yesterdays post, BTC had fallen from $8500 down to $8100. Now, is this our higher low for the weekly chart or is further downside likely?
I'm on the side of further downside is more likely than not. Certainly does not have to and ideally still would love to see the bulls hold the $7800-8200 range for a higher low on weekly for a very healthy equilibrium pattern.
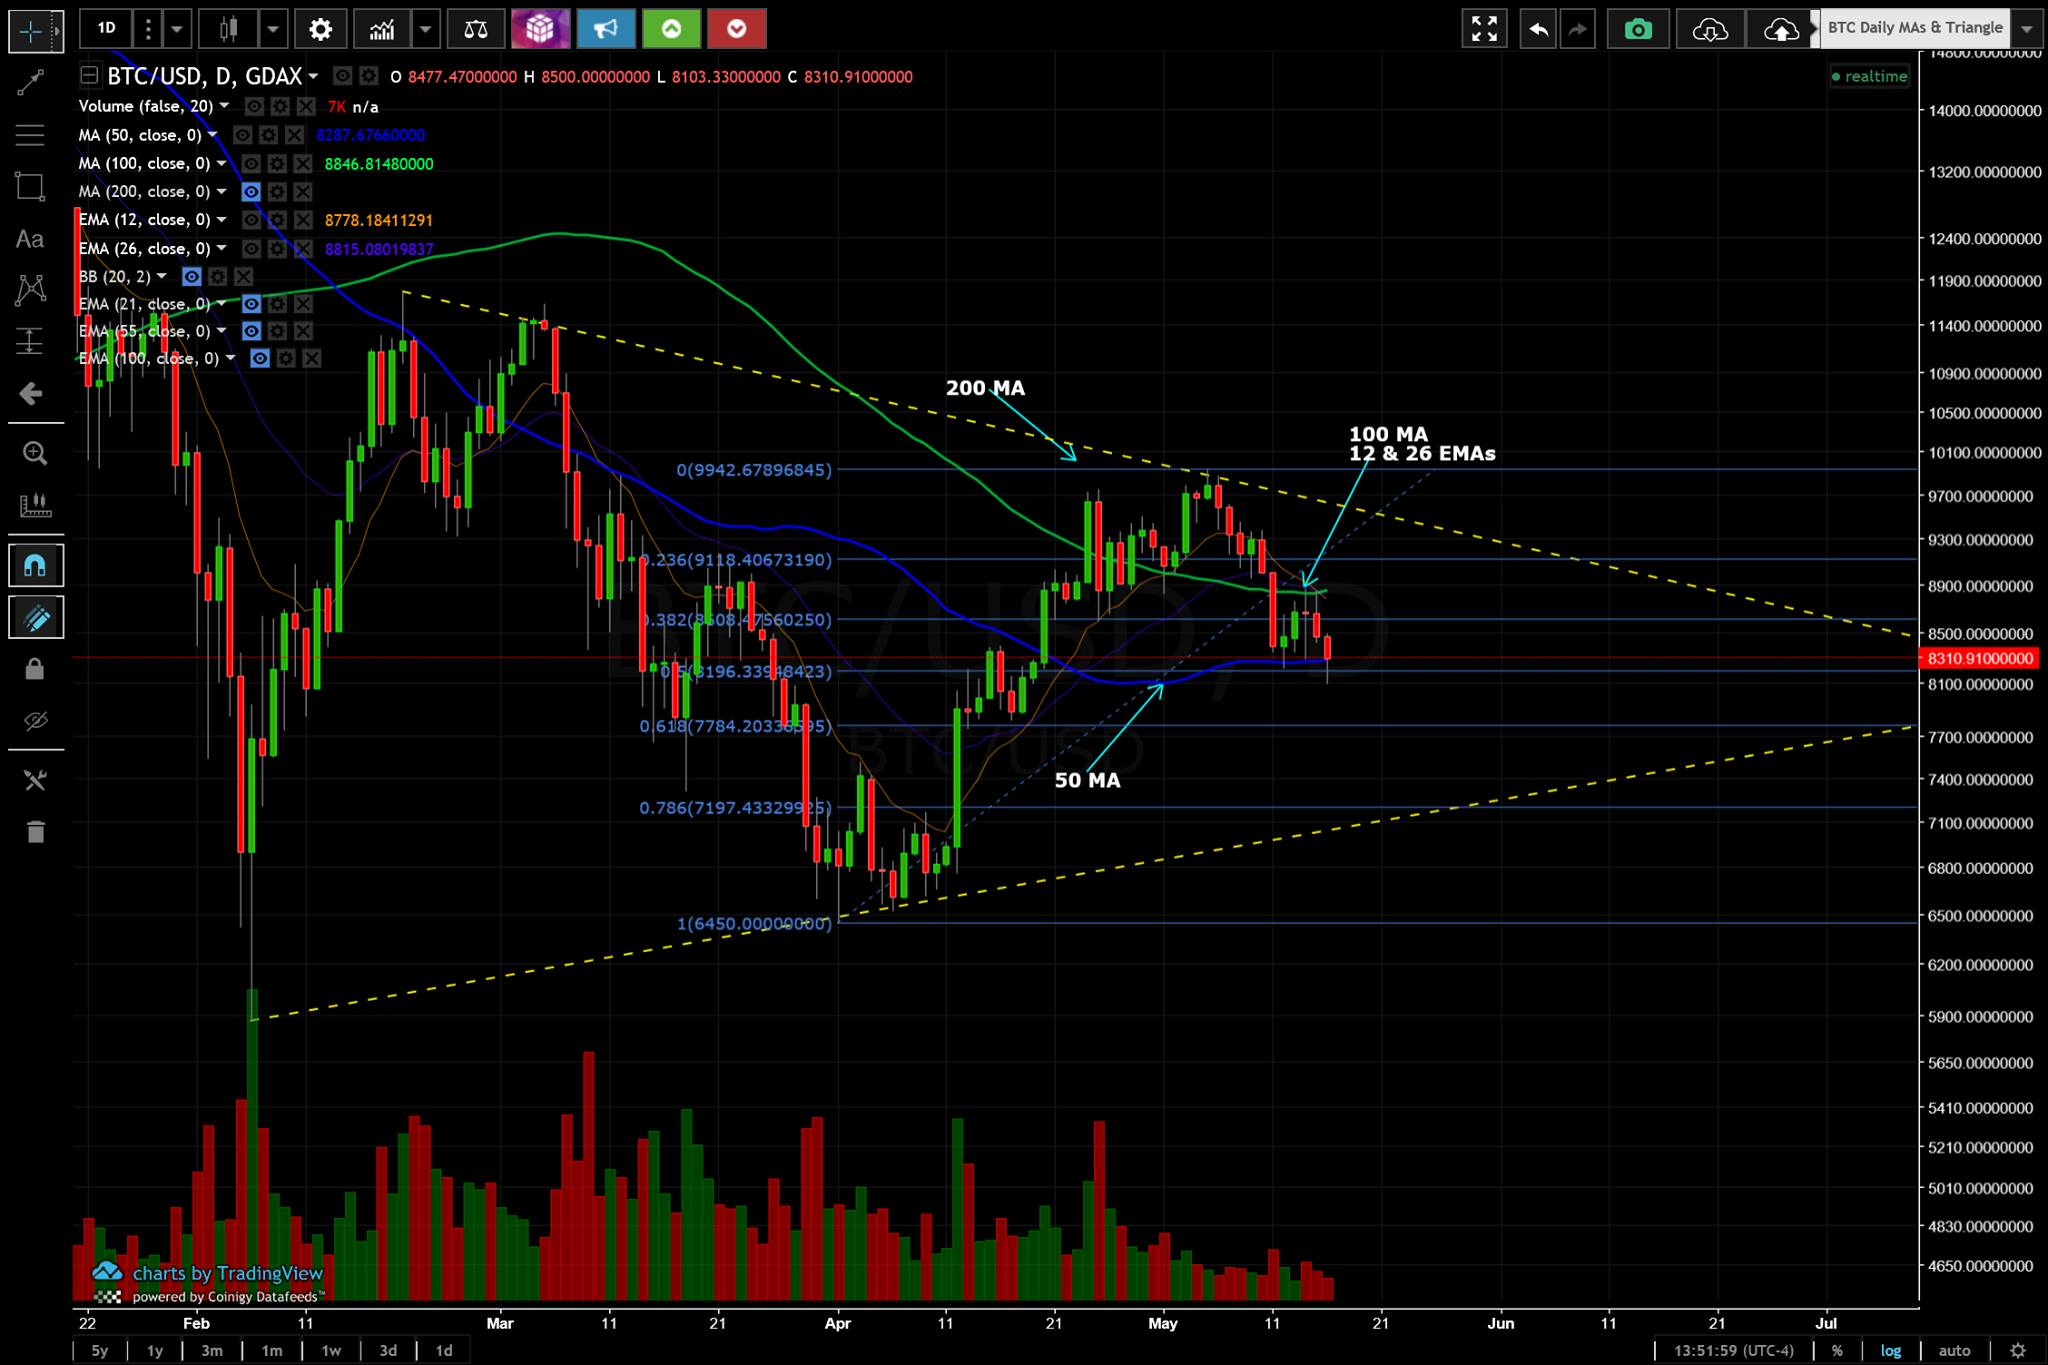
Digging deeper into the numbers and why I was expecting this first range. On this daily chart, I've overlaid a Fibonacci where our .5 Fib line coincides with the $8200 level and our .618 Fib line sits down around $7800. Further on our daily chart, our next support for a higher low is over at $7822 which occurred a few days after our large pump from $6700's up to $8000 in a single day.
So what happens if $7800-8200 range does not hold? Then I will look to next likely support area which to me is down at $7200. This lines up with our .786 Fib line as well as the bottom of a large triangle we are in.
Below that and we have $7k psychological and our must hold level to me is $6450 to stay within the weekly equilibrium.
If we do manage to fall towards $6500-7k then to me this is more bearish for the equilibrium since we are scraping near the bottom of the equilibrium on weekly chart.
If we bounce off .786 line around $7200 then it's closer towards a neutral on equilibrium which is perfectly healthy for an overall neutral pattern.
Bulls will ideally want to hold this $7800-8200 range in my opinion to maintain far away from the higher low of $6450.
All scenarios perfectly fine for the weekly chart however and I'll continue to remain neutral overall until the weekly chart pattern plays out.
Purpose to me for TA, is just to give probabilities of support/resistance and be prepared for any situation. While I hope $7800-8200 range does hold for a higher low, there is still plenty of justification for lower levels. I will continue to play the charts the same way I have for 2018 with just low risk entries, quick flips for profits off oversold bounces or equilibrium pattern breaks. I recognize trading is not for everyone and most should not trade but to me, TA remains a fantastic tool to have and utilize to recognize why an entry or exit is wise or not.
Next target $8,000
may b