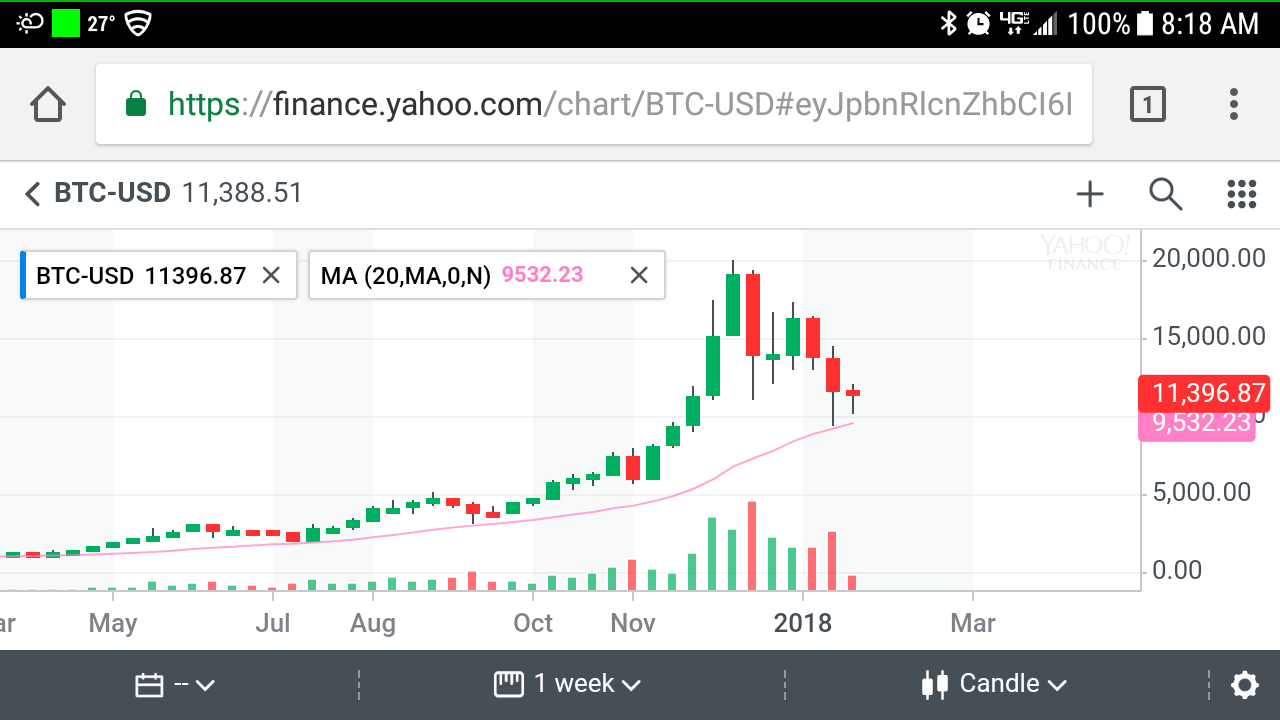
Bitcoin chart that makes sense
So I was studying the bitcoin chart and looking at different patterns. Yes I drew some triangles too. However trying to make sense of all these patterns and lines on the chart is quite confusing. Bitcoin and the other altcoins don't follow the rules half the time. I see countless videos on triangles, support and resistance lines. Also on which indicators will make you the most money. All this is just fluff. I mean it is good to know how patterns and indicators typically function but in the end you got to make a judgment call of your own. So do your own due diligence.
The chart on this post in my opinion is what I think bitcoin respects. I think we will see a retest of the 20k high soon. The chart is on weekly with the 20 day simple moving average added. Please do as I did go look for yourself. Check out the prior bull runs and pullback and come up with your own conclusions.

You might want to put a line through those two lows.
@originalworks